Most Forex pairs at the moment are trading sideways and are not showing clear trends, so it is important that traders have good range trading skills and are good at identifying price flip levels. Without the crucial skill of being able to pick out the key price flip levels, it can be hard for traders to spot out trades in ranging markets when price does move into a sideways trading period. Traders can keep an eye out for a super in-depth trading lesson that will be out either today or tomorrow that discusses the processes traders need to go through to identify price flip levels and mark key support and resistance levels.
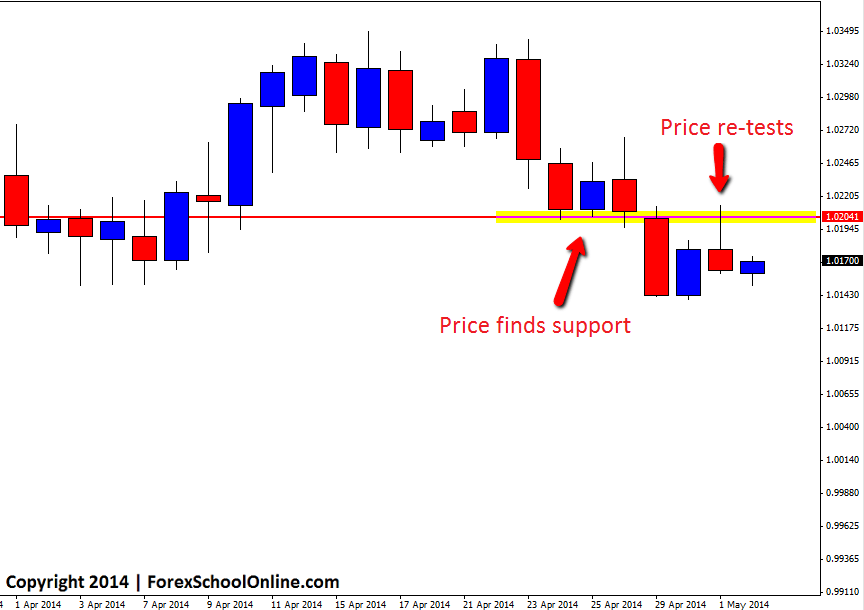
A good example of price recently in a sideways market and still firing off a price action signal is the AUDCAD. After moving lower the AUDCAD found support on the daily chart. It is important that traders mark their key levels on the daily chart because when they then go to the smaller time frames, they will always know they are making trades from a solid daily level and not what could possibly be a smaller time frame weaker level. After finding support at this level, price broke through and moved lower. This old support acted as a price flip level as price then moved back higher to re-test the old support/new resistance area. Whilst looking for a trade on the daily chart would not work because to play a reversal trade at the price flip level would mean the reversal signal would not be at a swing high and the price would have no space to fall into, traders could still use the same price flip level to look for trades on smaller time frames.
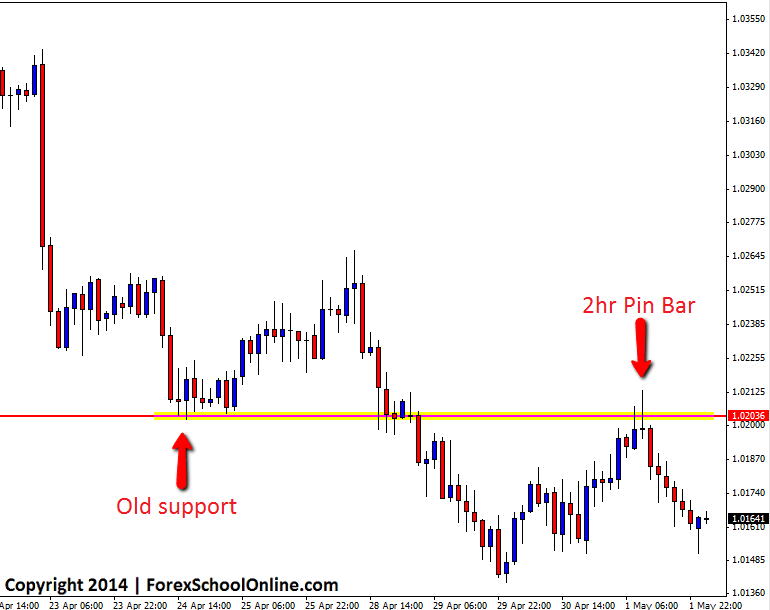
At this same price flip resistance; price on the 2hr chart formed a solid pin bar reversal that was sticking out and away and rejecting the resistance level. This pin bar was rejecting the exact same daily level and as you can see from the 2hr chart below; the level was very solid. These price flip levels from the daily chart where traders can then hunt trades on their intraday charts such as the 1hr, 4hr, 8hr or other time frames happen all the time if you know what to look for.
If you want to change your MT4 charts so that you can make any time frame chart you want like the 2hr chart below, read here: MT4 Change Time Frame Indicator
AUDCAD Daily Chart

AUDCAD 2hr Chart


Hello Smiley, as highlighted on the daily chart above; price moved lower before stalling and finding support. This is what we in here call a price flip area and you may call something different. See here: https://www.forexschoolonline.com//trade-forex-like-a-sniper-and-start-trading-from-kill-zones/ Price then broke this area and as I discuss in the article above once price rotates back higher it is a good time to start hunting trades at the old support/new resistance areas. Keep an eye out for the new article due out soon on this.
Johnathon
Jonathon how to identify this support level on Daily chart? I can't see any support level which you draw