AUD/USD Prediction – May 25
The market values of 0.7700 and 0.7800 are being the definite zones that the currency pair has kept over time. As of writing, the market records a 0.14% increase at the trading level of 0.7762.
AUD/USD Market
Key Levels:
Resistance levels: 0.7800, 0.7900, 0.8000
Support levels: 0.7700, 0.7600, 0.7500
AUD/USD – Daily Chart
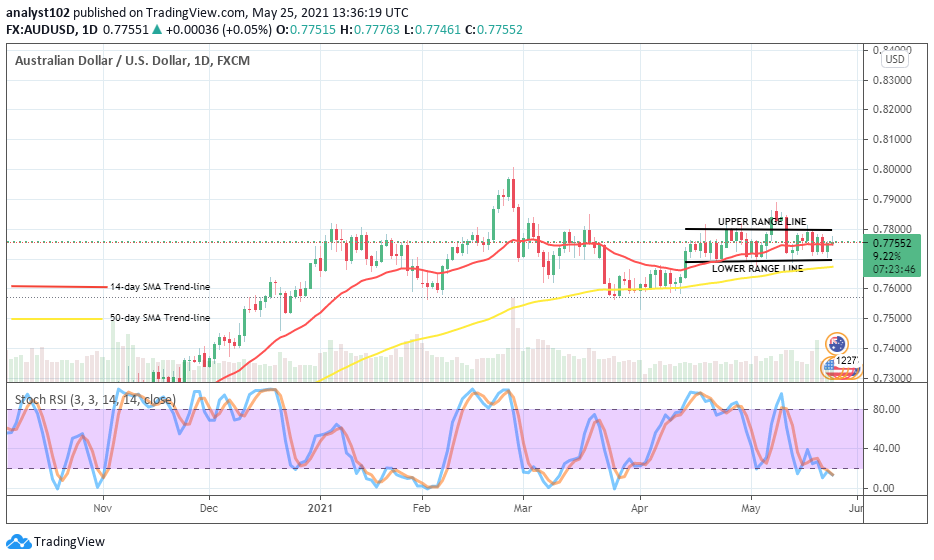
The AUD/USD daily chart shows a continual range-bound trading situation of the currency pair that has been on over a couple of weeks’ sessions. Variant candlesticks are being formed to characterize ups and downs in between close points of 0.7700 and 0.7800 marking the upper and the lower range lines respectively. The 14-day SMA trend line is located in the range lines making the 50-day SMA indicator place outside the range-bound zones closely below the lower range line. The Stochastic Oscillators have moved down to touch around range 20. Yet, they show less active motion signal of the market to probably continue moving in a range-bound manner When will the AUD/USD market stop moves in range lines?
As long as the two major market movers remain less active in the market, then, the current range-moving outlook will have to prolong through different sessions. Under such settings, price decent entry for most buy positions will have to feature from the lower end of the lower rang-line at 0.7700.
Almost in the same vein, sellers need to pull down forces on the AUD/USD price at the market level of 0.7800. However, a sudden breakout at the upper range line may put the base currency on a better hedge of the counter currency. Traders need the backing of their entries with active price action before joining the trade.
Summarily, if the market persistently shows up in the range-bound zones, then, there will mostly be a good time for buyers to place a buy order at the lower range line. And, equally, if price gets to the upper range line, it will be a good chance for sellers to place a sell position. AUD/USD 4-hour Chart
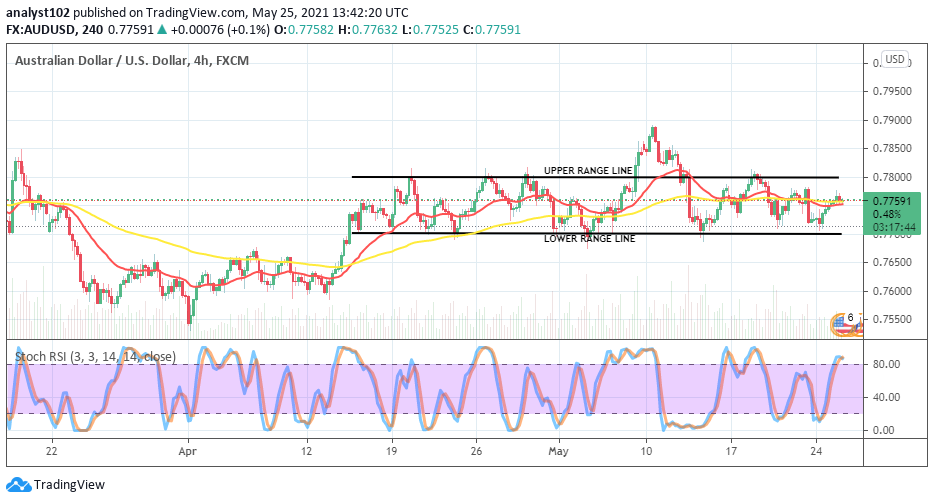
On the 4-hour chart, AUD/USD price is also traded in the same range values as it is depicted on the daily chart. Both the SMA trend lines are closely moving in the range lines of the currency pair. The 14-day SMA trend-line is tightly below the 50-day SMA as they both point towards the east direction to signaling ongoing range-bound moves. The Stochastic Oscillators are now in the overbought region with closed hairs. It now appears that Australian currency may soon relax its position around the point of 0.7765 so that bears may be able to stage a come-back to continually push possibly within the range-bound zones.
Note: Forexschoolonline.com is not a financial advisor. Do your research before investing your funds in any financial asset or presented product or event. We are not responsible for your investing results.
Learn to Trade Forex Online
AUD/USD Trades in Range-Bound Zones
Footer

ForexSchoolOnline.com helps individual traders learn how to trade the Forex market
WARNING: The content on this site should not be considered investment advice and we are not authorised to provide investment advice. Nothing on this website is an endorsement or recommendation of a particular trading strategy or investment decision. The information on this website is general in nature so you must consider the information in light of your objectives, financial situation and needs.
Investing is speculative. When investing your capital is at risk. This site is not intended for use in jurisdictions in which the trading or investments described are prohibited and should only be used by such persons and in such ways as are legally permitted. Your investment may not qualify for investor protection in your country or state of residence, so please conduct your own due diligence or obtain advice where necessary. This website is free for you to use but we may receive a commission from the companies we feature on this site.
We Introduce people to the world of currency trading. and provide educational content to help them learn how to become profitable traders. we're also a community of traders that support each other on our daily trading journey
Forexschoolonline.com is not a financial advisor. Do your research before investing your funds in any financial asset or presented product or event. We are not responsible for your investing results.

Leave a Reply