AUD/USD Prediction – November 15
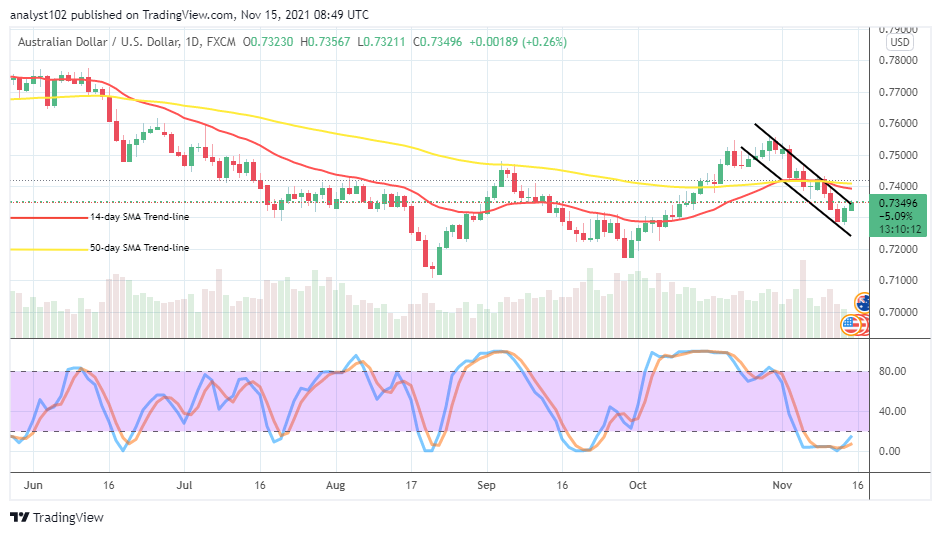
Recently, it recorded that the AUD/USD market operations experienced a downward correction in its valuation. But, now, the currency pair trade sets for recovery, having hit a support line to trade around 0.7349 at a percentage rate of about 0.26 positive.
AUD/USD Market
Key Levels:
Resistance levels: 0.7400, 0.7500, 0.7600
Support levels: 0.7200, 0.7100, 0.7000
AUD/USD – Daily Chart
The AUD/USD daily chart reveals that the fiat-currency pair trade sets for recovery, having succumbed to a line of price corrections in the recent past operations. The 14-day SMA trend line has intercepted the 50-day SMA trend line from the top, separated by a smaller space. The upper bearish channel trend line has touched in the course of the current recovery moving mode of the trade. The Stochastic Oscillators are in the oversold region, trying to open the lines northbound close beneath the range of 20. That suggests that an upward motion is in the loom. Has the AUD/USD market found reliable support around 0.7300 as the currency pair trade sets for a recovery?
From the technical viewing, the AUD/USD market seems to have found support around 0.7300 as the currency pair trade sets for a recovery motion presently. Long-entry position takers are expectant ought to have launched buy orders during the emergence of yesterday’s bullish candlestick before the touching of the upper bearish channel trend line. In pursuance of the recovery trend, buyers may have to be wary of any attempt to revert the move violently against the value line mentioned earlier.
On the downside, the AUD/USD market sellers may now have to suspend further shorting orders as it has established that the currency pair price now sets for e recovery movement. In the long run, of the market slowing down its current embarked rallying motion, the market tends to enter a line of convergences between the levels of 0.7500 and 0.7400 at a later trading session.
Summarily, as it currently depicted that the market has embarked upon a recovery motion, it would be psychologically wise that traders lookout for decent buy entries that the market may give around a lower trading spot underneath the SMA indicators afterward. AUD/USD 4-hour Chart
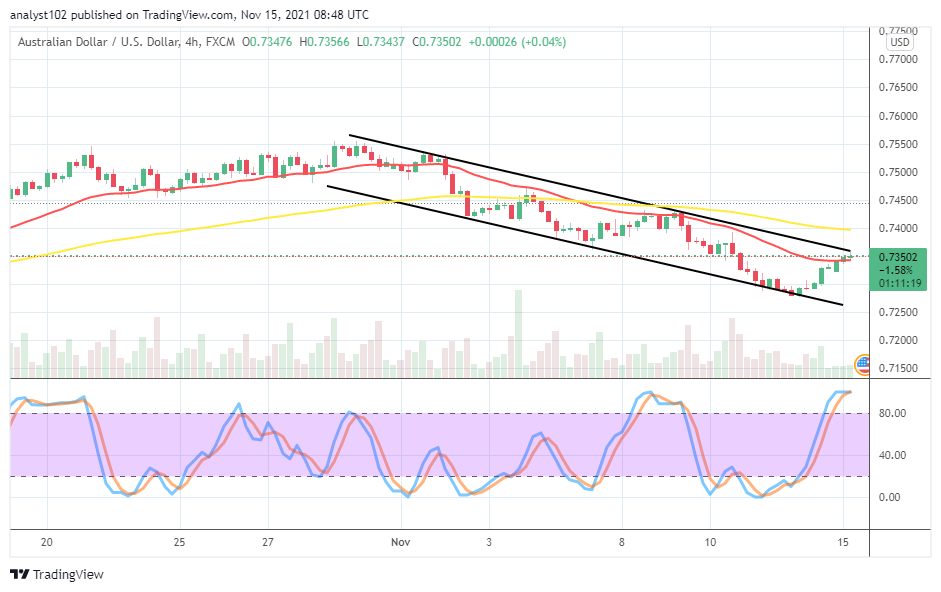
The AUD/USD 4-hour chart showcases that despite the currency pair trade sets for a recovery motion, the market’s trend is in a bearish outlook. The 50-day SMA trend line is above the 14-day SMA trend line. The Stochastic Oscillators have moved into the overbought region, with the lines closed within it. At this point, it appears that the coin pair trade tends to lose momentum under the resistance value line of 0.7400. A sudden break down at 0.7300 may extend purposely to test a lower support level around 0.7250. Traders are, therefore, advised to allow some degrees of pull-downs carrying a quick rebounding effort before considering buying positions afterward.
Note: Forexschoolonline.com is not a financial advisor. Do your research before investing your funds in any financial asset or presented product or event. We are not responsible for your investing results.
Learn to Trade Forex Online
AUD/USD Trade Sets for Recovery
Footer

ForexSchoolOnline.com helps individual traders learn how to trade the Forex market
WARNING: The content on this site should not be considered investment advice and we are not authorised to provide investment advice. Nothing on this website is an endorsement or recommendation of a particular trading strategy or investment decision. The information on this website is general in nature so you must consider the information in light of your objectives, financial situation and needs.
Investing is speculative. When investing your capital is at risk. This site is not intended for use in jurisdictions in which the trading or investments described are prohibited and should only be used by such persons and in such ways as are legally permitted. Your investment may not qualify for investor protection in your country or state of residence, so please conduct your own due diligence or obtain advice where necessary. This website is free for you to use but we may receive a commission from the companies we feature on this site.
We Introduce people to the world of currency trading. and provide educational content to help them learn how to become profitable traders. we're also a community of traders that support each other on our daily trading journey
Forexschoolonline.com is not a financial advisor. Do your research before investing your funds in any financial asset or presented product or event. We are not responsible for your investing results.

Leave a Reply