AUD/USD Price Prediction – April 11
An overbought trading condition has led the AUD/USD market operation to be unable to push higher past some resistant trading lines lately. Based on that, the currency pair trade reverts to correction, having hit a resistance beneath the 0.7700, making the transactions currently taking between 0.7465 and 0.7417 value-lines as of writing.
AUD/USD Market
Key Levels:
Resistance levels: 0.7500, 0.7600, 0.7700
Support levels: 0.7300, 0.7200, 0.7100
AUD/USD – Daily Chart
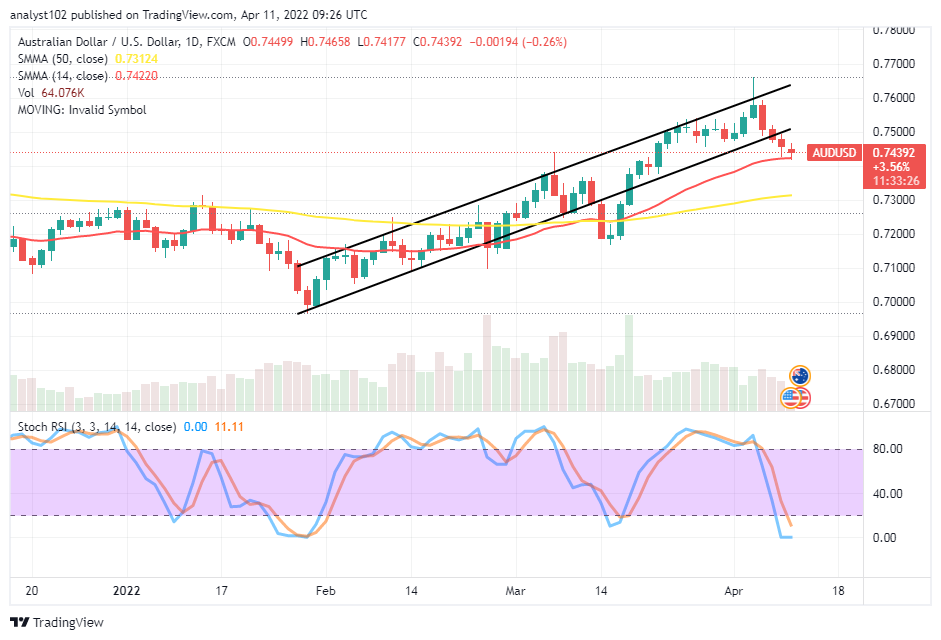
The AUD/USD daily chart reveals the currency pair trade reverts to a correction, hitting a resistance beneath the 0.7700 trading level. The 14-day SMA indicator is above the 50-day SMA indicator. The emergence of variant bearish candlesticks features serially downward closer over the smaller SMA trend line. The Stochastic Oscillators are dipped into the oversold region to raise a warning against getting reliable new entries for fresh downs in the subsequent sessions. Will the current drawdown outlook in the AUD/USD market operations lead to a bearish trend returning process afterward as the trade reverts to a correction?
The current drawdown outlook in the AUD/USD market operations appears not to have the ideal catalyst to nudge the direction of price into a bearish-trending motion as the currency pair trade reverts to a correction, having hit a resistance beneath 0.7700. The situation has led price into an oversold condition that buyers may have to regain their stances around 0.7400 or a bit lower level toward 0.7300 during the subsequent sessions.
On the downside of the technical analysis, the AUD/USD market sellers will have to hold the trading trait firmly in a consolidation state around the trend line of the 14-day SMA to get more downs. The occurrence of a bullish candlestick at a lower support trading level will potentially lead price to rebound against further downs in no time.
The analytics, at a glance, the AUD/USD traders should be wary of joining the correctional motion to the south, especially the 14-day SMA trend line breaches to the downside, as there can be a rebounding motion following it almost immediately finding support at a lower spot. AUD/USD 4-hour Chart
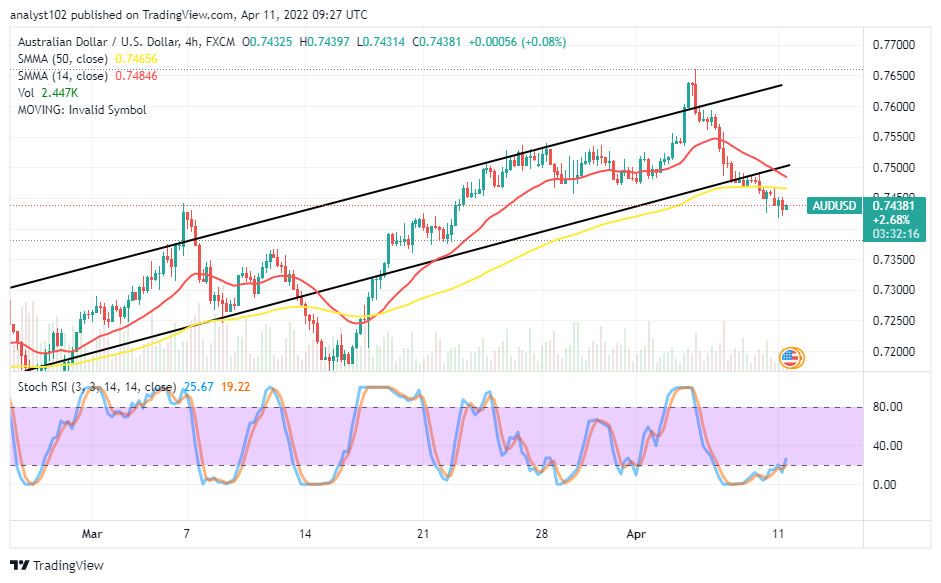
The AUD/USD 4-hour chart shows the currency pair trade reverts to a correction, hitting a resistance beneath 0.7700. The 14-day SMA indicator has bent southward closely above the 50-day SMA indicator. The bullish trend lines drew to keep the expectation of seeing the market getting a rebound in the near time. The Stochastic Oscillators are in the oversold region, slantingly moving in a consolidation manner toward the northbound within. That signifies the buyers are taking time to make a comeback soon.
Note: Forexschoolonline.com is not a financial advisor. Do your research before investing your funds in any financial asset or presented product or event. We are not responsible for your investing results.
Learn to Trade Forex Online
AUD/USD Trade Reverts to a Correction, Hitting a Resistance Beneath 0.7700
Footer

ForexSchoolOnline.com helps individual traders learn how to trade the Forex market
WARNING: The content on this site should not be considered investment advice and we are not authorised to provide investment advice. Nothing on this website is an endorsement or recommendation of a particular trading strategy or investment decision. The information on this website is general in nature so you must consider the information in light of your objectives, financial situation and needs.
Investing is speculative. When investing your capital is at risk. This site is not intended for use in jurisdictions in which the trading or investments described are prohibited and should only be used by such persons and in such ways as are legally permitted. Your investment may not qualify for investor protection in your country or state of residence, so please conduct your own due diligence or obtain advice where necessary. This website is free for you to use but we may receive a commission from the companies we feature on this site.
We Introduce people to the world of currency trading. and provide educational content to help them learn how to become profitable traders. we're also a community of traders that support each other on our daily trading journey
Forexschoolonline.com is not a financial advisor. Do your research before investing your funds in any financial asset or presented product or event. We are not responsible for your investing results.

Leave a Reply