AUD/USD Prediction – September 13
There has been a sign that the AUD/USD trade operation retraces in its recovery price movements recently embarked. 0.7358 is around the level that the currency pair’s price trades as of writing at a positive percentage rate of about 0.13. There is an intake that the base currency will potentially push to the upside in no time.
AUD/USD Market
Key Levels:
Resistance levels: 0.7500, 0.7600, 0.7700
Support levels: 0.7300, 0.7200, 0.7100
AUD/USD – Daily Chart
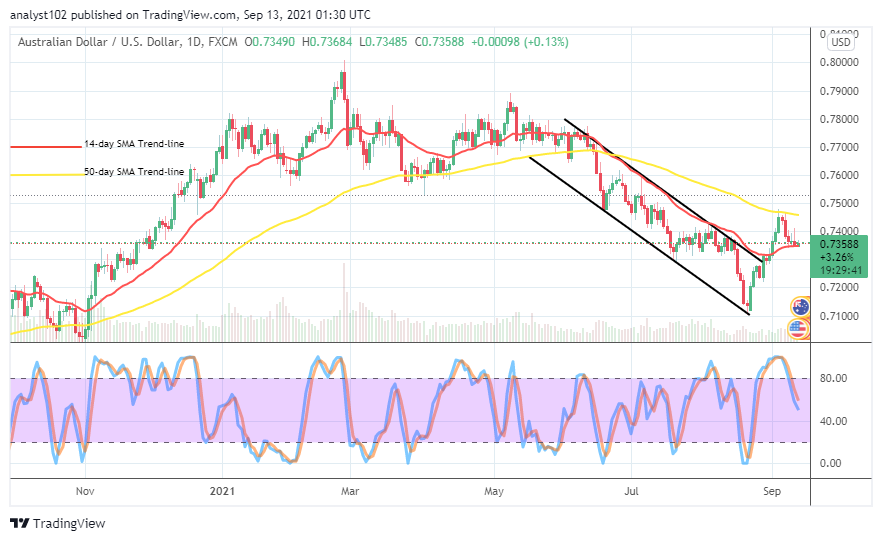
The AUD/USD daily chart renewals that the fiat currency-pair trade operation retraces southward from a high level of the trading zone. Between the September 3rd and 7th periods, price touched the bigger SMA trend line on the sell signal side. The 50-day SMA indicator is above the 14-day SMA indicator. The bearish channel trend lines drew helped to observe the critical point at 0.7300 that the market has been able to breach northward. The Stochastic Oscillators have slowly bent southbound to complement the pace at which the market is retracing. Is there any probability that the AUD/USD price plunge back into bearish trend lines as the trade operation retraces?
There has been no indication that the AUD/USD market will sustainably plunge back into bearish trend lines as the trade operation retraces currently. In the meantime, the market may have to make room for slight downward moves, possibly until about a couple of sessions. While that presumption is so likely ongoing, bulls would have to draw attention to a sign capable of signifying an end to the downward forces so that buy entry order could get its way.
On the downside, the 0.73000 level will serve as the support line the AUD/USD market bears may have to breach southward forcefully. But, only for fast unduly profits. In the light of that playing out, late sell entry will catch up in the bears’ trap. Traders intending to go further on the market to the downside have to exercise some degrees of pre-cautiousness.
Summarily, at this point of price retracement course, the AUD/USD market may still hold down for more slight downs so that price may find support around the lower line. The point around the level of 0.73000 will most likely be where the currency pair tends to regain the momentum to swing back to the way up. AUD/USD 4-hour Chart
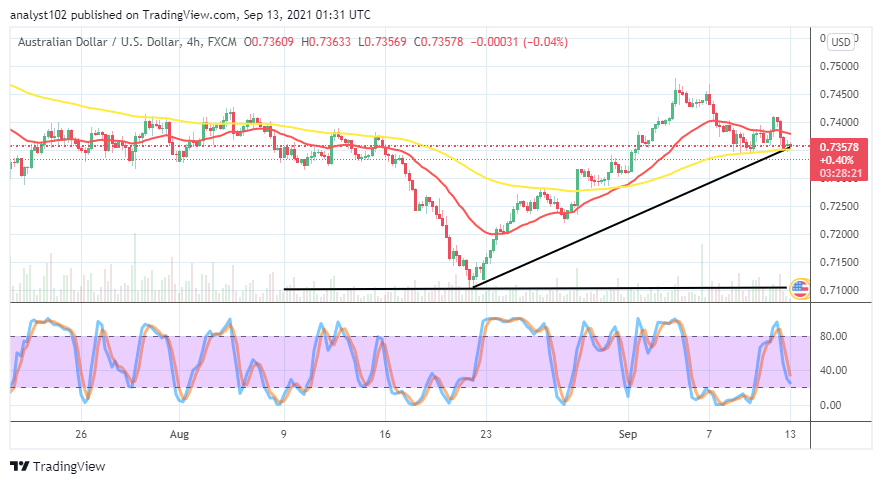
The AUD/USD 4-hour chart depicts that the currency pair trade operation retraces southward from around 0.7450 to trade around 0.7350. The 14-day SMA indicator is above the 50-day SMA indicator as the bullish trend line drew beneath the bigger SMA in a supportive manner. The Stochastic Oscillators have moved southbound closer to the range of 20. There can be more smaller-sized bearish candlesticks, denoting a relative continuation in the downward motion. However, short-position takers advised being wary of their presence re-launching.
Note: Forexschoolonline.com is not a financial advisor. Do your research before investing your funds in any financial asset or presented product or event. We are not responsible for your investing results.
Learn to Trade Forex Online
AUD/USD Trade Operation Retraces
Footer

ForexSchoolOnline.com helps individual traders learn how to trade the Forex market
WARNING: The content on this site should not be considered investment advice and we are not authorised to provide investment advice. Nothing on this website is an endorsement or recommendation of a particular trading strategy or investment decision. The information on this website is general in nature so you must consider the information in light of your objectives, financial situation and needs.
Investing is speculative. When investing your capital is at risk. This site is not intended for use in jurisdictions in which the trading or investments described are prohibited and should only be used by such persons and in such ways as are legally permitted. Your investment may not qualify for investor protection in your country or state of residence, so please conduct your own due diligence or obtain advice where necessary. This website is free for you to use but we may receive a commission from the companies we feature on this site.
We Introduce people to the world of currency trading. and provide educational content to help them learn how to become profitable traders. we're also a community of traders that support each other on our daily trading journey
Forexschoolonline.com is not a financial advisor. Do your research before investing your funds in any financial asset or presented product or event. We are not responsible for your investing results.

Leave a Reply