AUD/USD Price Prediction – AUGUST 28
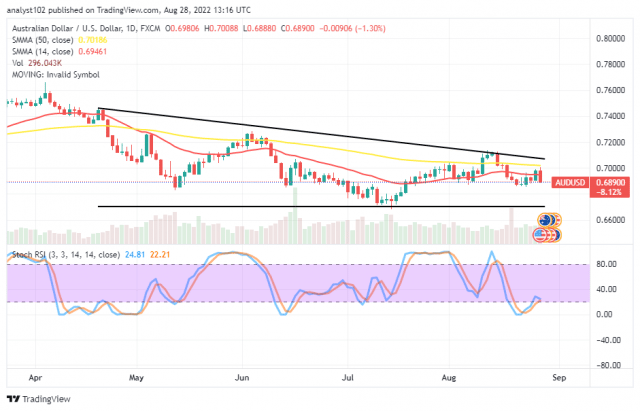
The AUD/USD trade operation holds below the 0.7000 line after pushing for a test of it from a lower-trading spot. Presently, the price is trading around 0.6890 at a negative percentage rate of 1.30.
AUD/USD Market
Key Levels:
Resistance levels: 0.7000, 0.7100, 0.7200
Support levels: 0.6750, 0.6650, 0.6550
AUD/USD – Daily Chart
The AUD/USD daily chart depicts that the currency pair trade operation holds below the 0.7000 resistance, following a touch of it while trying to swing upward from a lower value line around 0.6800 level in recent time. The 14-day SMA indicator is at 0.6946, underneath the 0.7019 value line of the 50-day SMA indicator. The Stochastic oscillators have crossed northbound from the oversold region to place at 22.21 and 24.81 range values. They are attempting to close their lines southward.
Will the AUD/USD market push for lows further toward the 0.6700 support level?
The stage seems set for the AUD/USD market operation to push for more lows toward the 0.6700 support level as the currency pair trade operation holds below the 0.7000 resistance level, having experienced a touch. A downward gap may occur to let bears have completion of the declining trend in the near time. If that assumption has to be, buyers need to brace up for launching long orders while price spikes up from a lower zone afterward.
On the downside of the technical, selling activities are on the verge of fading off in the AUD/USD market operations. The forces are carrying bearish signals. But it is dicey to detect a decent selling order entry. Short-position placers should be wary of a bounce-off capable of erasing the bearish candlestick to its maximum point around the 50-day SMA.
The analytics, at a glance, a long-holding of the AUD/USD market trading situation beneath the 0.7000 resistance level will potentially lead the price to a lower-trading zone at the 0.67000 support level before bulls tempt to make a come-back.
AUD/USD 4-hour Chart
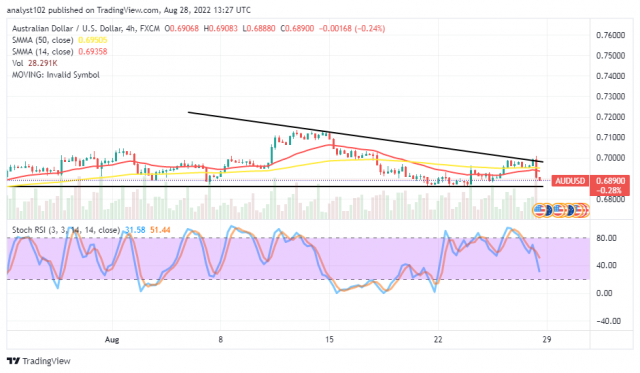
The AUD/USD medium-term chart showcases the trade, holding below the 0.7000 resistance level when the market failed to surge northward past it based on what the last 4-hour trading candlestick depicted. The 14-day SMA indicator is at 0.6936 above the 0.6951 value line of the 50-day SMA indicator. The Stochastic Oscillators have crossed southbound from the overbought region, maintaining 51.44 and 31.58 range values.
Note:Forexschoolonline.com is not a financial advisor. Do your research before investing your funds in any financial asset or presented product or event. We are not responsible for your investing results.
Learn to Trade Forex Online
AUD/USD Trade Operation Holds Below 0.7000
Footer

ForexSchoolOnline.com helps individual traders learn how to trade the Forex market
WARNING: The content on this site should not be considered investment advice and we are not authorised to provide investment advice. Nothing on this website is an endorsement or recommendation of a particular trading strategy or investment decision. The information on this website is general in nature so you must consider the information in light of your objectives, financial situation and needs.
Investing is speculative. When investing your capital is at risk. This site is not intended for use in jurisdictions in which the trading or investments described are prohibited and should only be used by such persons and in such ways as are legally permitted. Your investment may not qualify for investor protection in your country or state of residence, so please conduct your own due diligence or obtain advice where necessary. This website is free for you to use but we may receive a commission from the companies we feature on this site.
We Introduce people to the world of currency trading. and provide educational content to help them learn how to become profitable traders. we're also a community of traders that support each other on our daily trading journey
Forexschoolonline.com is not a financial advisor. Do your research before investing your funds in any financial asset or presented product or event. We are not responsible for your investing results.

Leave a Reply