AUD/USD Price Prediction – June 6
There have been rallying motions in the AUD/USD market operations. But, presently, the currency pair trade appears, getting exhaustion in its northward force. Price is trading around 0.7228 at a minimal 0.31 percent positive.
AUD/USD Market
Key Levels:
Resistance levels: 0.7300, 0.7400, 0.7500
Support levels: 0.7100, 0.7000, 0.6900
AUD/USD – Daily Chart
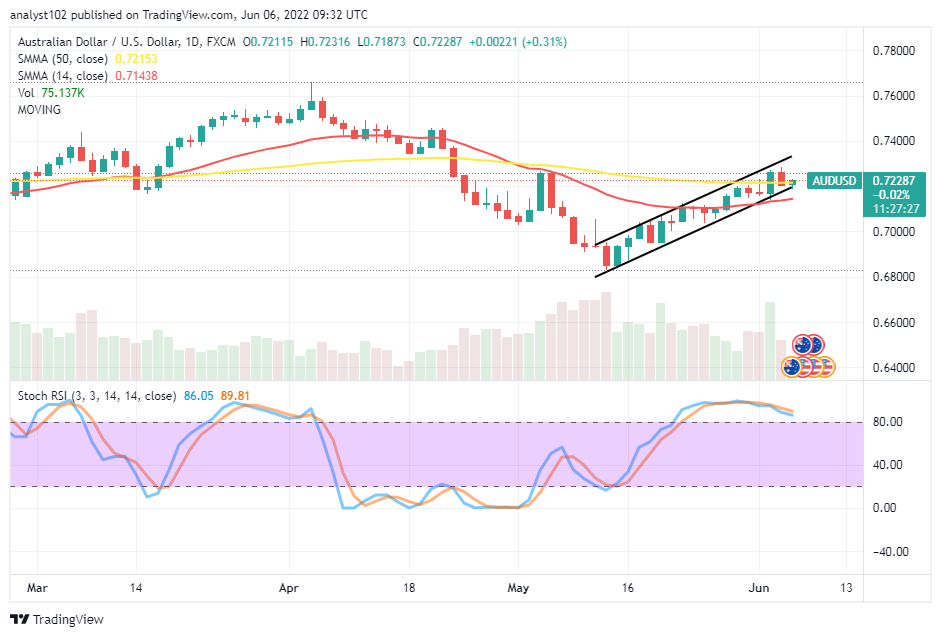
The daily chart showcases that the currency pair trade appears, exhausting northward force in the bullish channel trend lines drawn against the SMA trend lines. The 14-day SMA indicator is underneath the 50-day SMA indicator. The Stochastic Oscillators are in the overbought region, moving in a consolidation manner. A bearish candlestick has formed, spanning from a resistance point around the 0.7300 level to denote a barrier occurred against seeing more sustainable ups past over it. Will the AUD/USD price soon get lows beneath the 0.7300 resistance level?
There has been a bearish candlestick to have spanned from around the 0.7300 resistance level, coupling it with an overbought trading condition the AUD/USD market is currently facing. It can deduce some lows will feature in the near time. Buyers may have to trail some of the positions opened between the points of 0.6800 and 0.7000 to take profit between 0.7300 and 0.7400 value lines.
On the downside of the technical analysis, the trading situation of the AUD/USD appears getting prepared to create an avenue for sellers to launch a come-back into the currency pair transactions around the resistances of 0.7300 and 0.7400 levels. A false forceful breakout against those resistance value lines will give in back to a decent selling entry order. Therefore, short-position takers are to be on the lookout for active reverses at a high trading point before considering joining and launching a sell order.
The analytics, at a glance, the AUD/USD market operations are vastly averaging a high-resistant trading zone to give back to a correction. AUD/USD 4-hour Chart
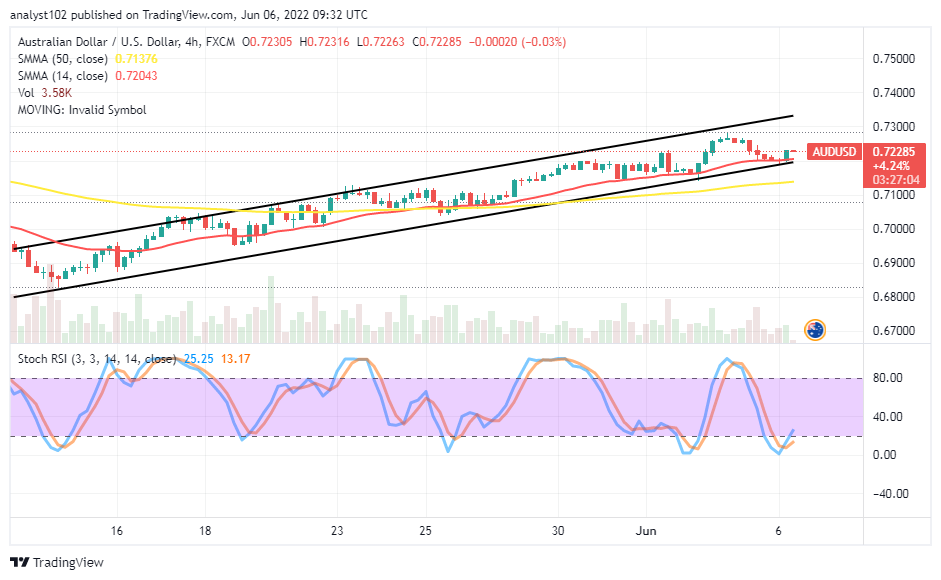
The AUD/USD medium-term chart reveals the currency pair trade appears, keeping long in the bullish channel trend lines drawn. The lower bullish trend line drew closely beneath the 14-day SMA indicator above the 50-day SMA indicator. The Stochastic Oscillators are in the oversold region, trying to cross northbound against the 20 range. A bullish has formed slightly from the area of smaller SMA and the lower bullish trend line. That denotes some upward pressures may still play out to revisit a resistance around the 0.7300 and the 0.7400 in the long-term run before surrendering to a downtrend.
Note:Forexschoolonline.com is not a financial advisor. Do your research before investing your funds in any financial asset or presented product or event. We are not responsible for your investing results.
Learn to Trade Forex Online
AUD/USD Trade Appears, Exhausting Northward Force
Footer

ForexSchoolOnline.com helps individual traders learn how to trade the Forex market
WARNING: The content on this site should not be considered investment advice and we are not authorised to provide investment advice. Nothing on this website is an endorsement or recommendation of a particular trading strategy or investment decision. The information on this website is general in nature so you must consider the information in light of your objectives, financial situation and needs.
Investing is speculative. When investing your capital is at risk. This site is not intended for use in jurisdictions in which the trading or investments described are prohibited and should only be used by such persons and in such ways as are legally permitted. Your investment may not qualify for investor protection in your country or state of residence, so please conduct your own due diligence or obtain advice where necessary. This website is free for you to use but we may receive a commission from the companies we feature on this site.
We Introduce people to the world of currency trading. and provide educational content to help them learn how to become profitable traders. we're also a community of traders that support each other on our daily trading journey
Forexschoolonline.com is not a financial advisor. Do your research before investing your funds in any financial asset or presented product or event. We are not responsible for your investing results.

Leave a Reply