AUD/USD Prediction – June 21
The financial record book of the AUD/USD market has had it that the currency pair suffers a drawdown significantly after a long session of trading around three range-bound zones of 0.7800, 0.7700, and 0.7600. The market now trades around a lower value of 0.7507 at a percentage rate of 0.39.
AUD/USD Market
Key Levels:
Resistance levels: 0.7600, 0.7700, 0.7800
Support levels: 0.7400, 0.7300, 0.7200
AUD/USD – Daily Chart
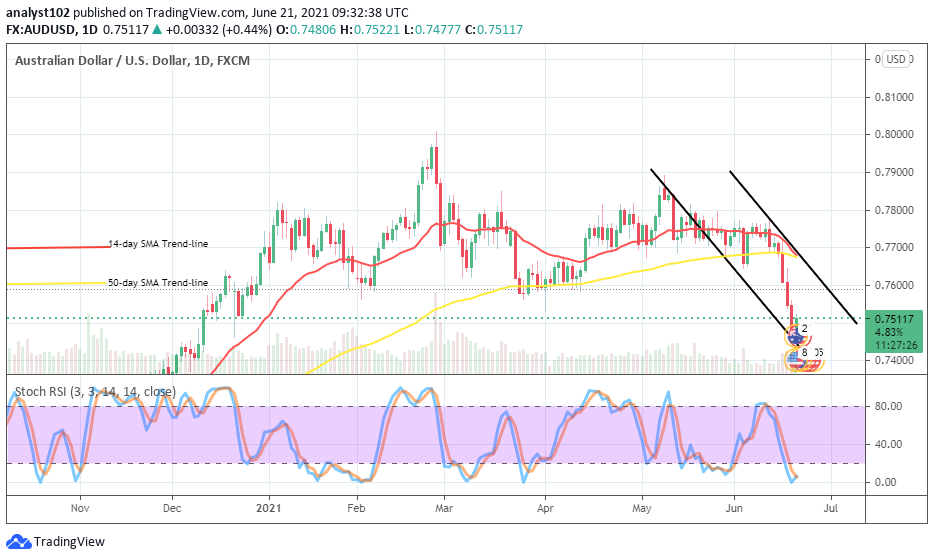
There has now been a significant drawdown as depicted on the AUD/ USD daily chart. During the time of range-bound trading position, the level of 0.7700 majorly featured in determining most of the past directions. The current downward trend takes its starting point as well around the level mentioned earlier. The bearish channels have drawn to mark the points at 0.7500 and 0.7400 to suggest the extent to which the current downward motion could push in the meantime. The 14-day SMA trend-line has bent towards the south to touch the 50-day SMA indicator from the top. The Stochastic Oscillators are dipped into the oversold region with the lines closed in an attempt to slightly point northbound. That portends that the downward force is getting reduced on a gradual note. Could it be that the bearish trend has fully returned in the AUD/USD currency pair?
There have been strong indications backing the full-fledged return of downward forces in the market valuation of AUD/USD currently. The kind of falling motion recorded so far has been in a straight-lined manner to indicate a heavily significant deprivation in the market. However, the forces have been indicated to have gotten to a point of being in the oversold area to tell that very soon bulls are expected to re-launch a come-back while strong support is finally built probably in between the lower levels of 0.7500 and 0.7400 at a later time.
Regarding getting to seeing more downward movements of the currency pair trading instruments, the downside momentum needed to be held stronger against any attempted rebounding move that may surface in between the points of 0.7600 and 0.7500 in the near time. But, currently, the price seems to be relaxing in going down freely further around the lower level of the point mentioned last.
Summarily, as the market has finally breached southward away from the areas of range-bound trading, it now portends that traders may have to be on the lookout for a sell entry especially while an upward move is actively being put on a reversal manner. But, some upward moves may also come up against poor sell entries. AUD/USD 4-hour Chart
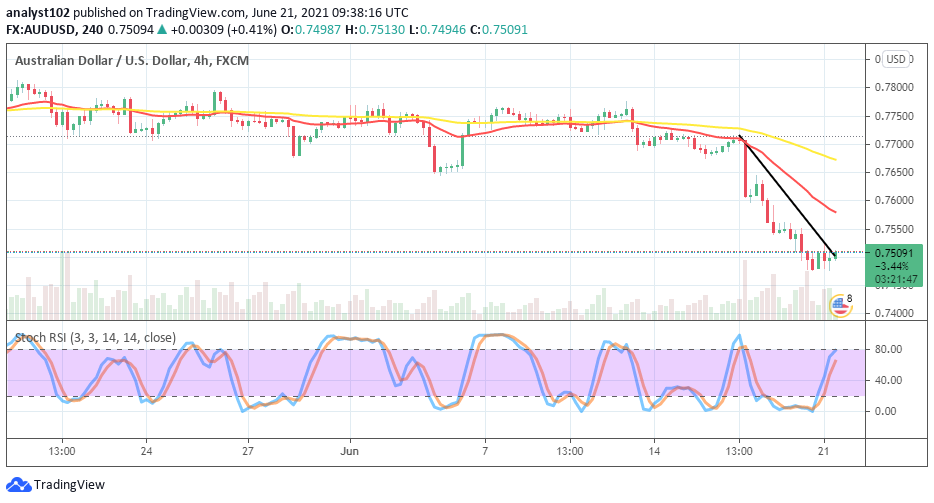
The AUD/USD medium-term chart has now shown that the currency pair trend is in a bearish run outlook while it broke down on June 16th day’s session from around 0.7700 level to now trade around a lower point of 0.7507. There has now been a space separating the SMAs. The bigger 50-day SMA trend-line is located over the smaller 14-day SMA indicator. The bearish trend-line drew across the SMAs to place at the current trading spot of the currency pair below them. The Stochastic Oscillators have northbound to touch range 80. And, they now appear attempting t close the lines. That could mean that bears are getting set for a re-positioning of an entry in the market which may come in between the points of 0.7500 and 0.7550 in the near time.
Note: Forexschoolonline.com is not a financial advisor. Do your research before investing your funds in any financial asset or presented product or event. We are not responsible for your investing results.
Learn to Trade Forex Online
AUD/USD Suffers a drawdown Significantly
Footer

ForexSchoolOnline.com helps individual traders learn how to trade the Forex market
WARNING: The content on this site should not be considered investment advice and we are not authorised to provide investment advice. Nothing on this website is an endorsement or recommendation of a particular trading strategy or investment decision. The information on this website is general in nature so you must consider the information in light of your objectives, financial situation and needs.
Investing is speculative. When investing your capital is at risk. This site is not intended for use in jurisdictions in which the trading or investments described are prohibited and should only be used by such persons and in such ways as are legally permitted. Your investment may not qualify for investor protection in your country or state of residence, so please conduct your own due diligence or obtain advice where necessary. This website is free for you to use but we may receive a commission from the companies we feature on this site.
We Introduce people to the world of currency trading. and provide educational content to help them learn how to become profitable traders. we're also a community of traders that support each other on our daily trading journey
Forexschoolonline.com is not a financial advisor. Do your research before investing your funds in any financial asset or presented product or event. We are not responsible for your investing results.

Leave a Reply