AUD/USD Prediction – July 5
The AUS/USD market springs up from a lower trading point below 0.7500 to trade around the line of 0.7529. The trade’s percentage rate as of writing stands around the figure of -0.05.
AUD/USD Market
Key Levels:
Resistance levels: 0.7600, 0.7700, 0.7800
Support levels: 0.7400, 0.7300, 0.7200
AUD/USD – Daily Chart
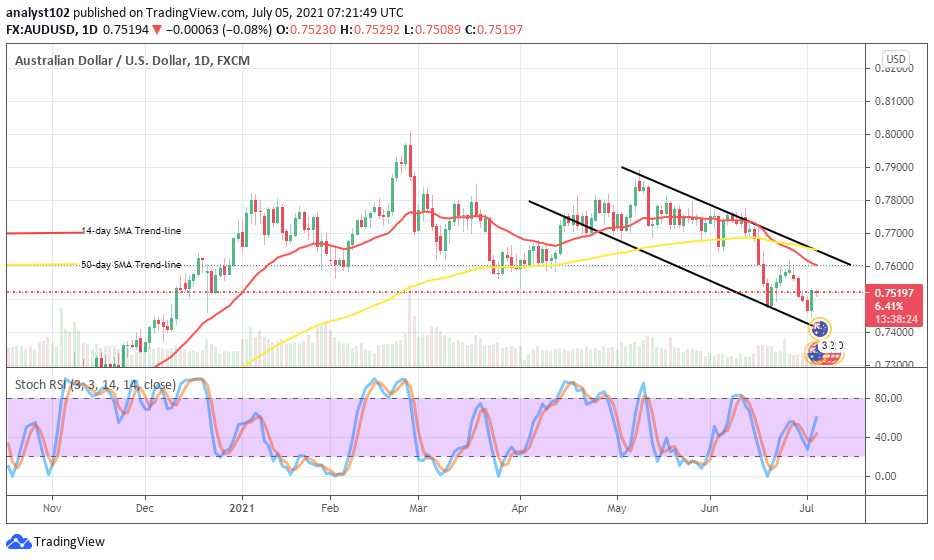
The AUD/USD daily chart depicts that the currency pair’s valuation now springs up from a lower point underneath the value of 0.7500. A well-featured bullish candlestick formed to back the present trading situation. It is also worthy of noticing that bearish channels are to denote the actual trading zones of the duo-currencies. The 14-day SMA indicator is underneath the 50-day SMA indicator above the current trading price. The Stochastic Oscillators have crossed the lines at range 40, pointing toward the north. That indicates a force in the market is of the upside. As the AUD/USD springs up, will it be strengthened northward further?
An indicator backs that there may be a furtherance of increase in valuation of AUD/USD as the market springs up from a lower point close to the lower bearish channel trend-line. Going by that bullish Japanese candlestick’s readings, bulls could ride on maximally to a higher point around the levels of 0.7600 or in an extension close to the level of 0.7700.
On the downside, the entry for a downward movement of this currency pair’s market needed to suspend until clarity seen while the price tends to lose momentum from an upside line. A closer observation reading of the indicators reveals that the level at 0.7600 will play a vital role in the determination of whether the currency trade will keep its current bearish trend or not.
In summary, traders are to pay attention to each end of the current bearish channel trend lines. The market level at 0.7600 is the upper end and, the level at 0.7400 is the lower end. A breakout or a breakdown of either will potentially cause more active movements in the currency pair’s trading activities. AUD/USD 4-hour Chart
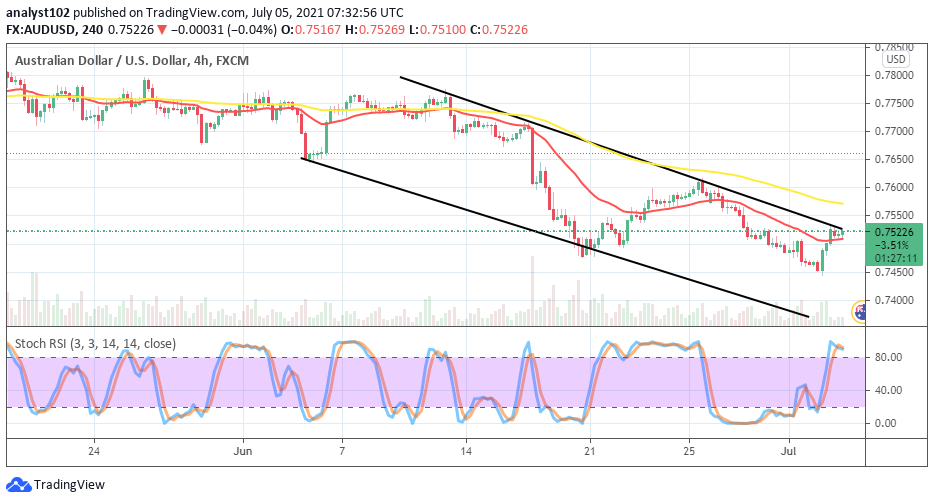
The AUD/USD medium-term price analysis chart also reveals that the market springs up touches the upper bearish channel trend-line. And, the Stochastic Oscillators are in the overbought region, suggesting that the base trading instrument’s capacity has somewhat used up presently. The 50-day SMA indicator is above the 14-day SMA indicator as they both point to the south. There is a line of smaller candlesticks on the other side of the buy signal of the smaller SMA. Going by those technical readings, the currency pair’s price appears to go down in valuation afterward.
Note: Forexschoolonline.com is not a financial advisor. Do your research before investing your funds in any financial asset or presented product or event. We are not responsible for your investing results.
Learn to Trade Forex Online
AUD/USD Springs up from Lower Point
Footer

ForexSchoolOnline.com helps individual traders learn how to trade the Forex market
WARNING: The content on this site should not be considered investment advice and we are not authorised to provide investment advice. Nothing on this website is an endorsement or recommendation of a particular trading strategy or investment decision. The information on this website is general in nature so you must consider the information in light of your objectives, financial situation and needs.
Investing is speculative. When investing your capital is at risk. This site is not intended for use in jurisdictions in which the trading or investments described are prohibited and should only be used by such persons and in such ways as are legally permitted. Your investment may not qualify for investor protection in your country or state of residence, so please conduct your own due diligence or obtain advice where necessary. This website is free for you to use but we may receive a commission from the companies we feature on this site.
We Introduce people to the world of currency trading. and provide educational content to help them learn how to become profitable traders. we're also a community of traders that support each other on our daily trading journey
Forexschoolonline.com is not a financial advisor. Do your research before investing your funds in any financial asset or presented product or event. We are not responsible for your investing results.

Leave a Reply