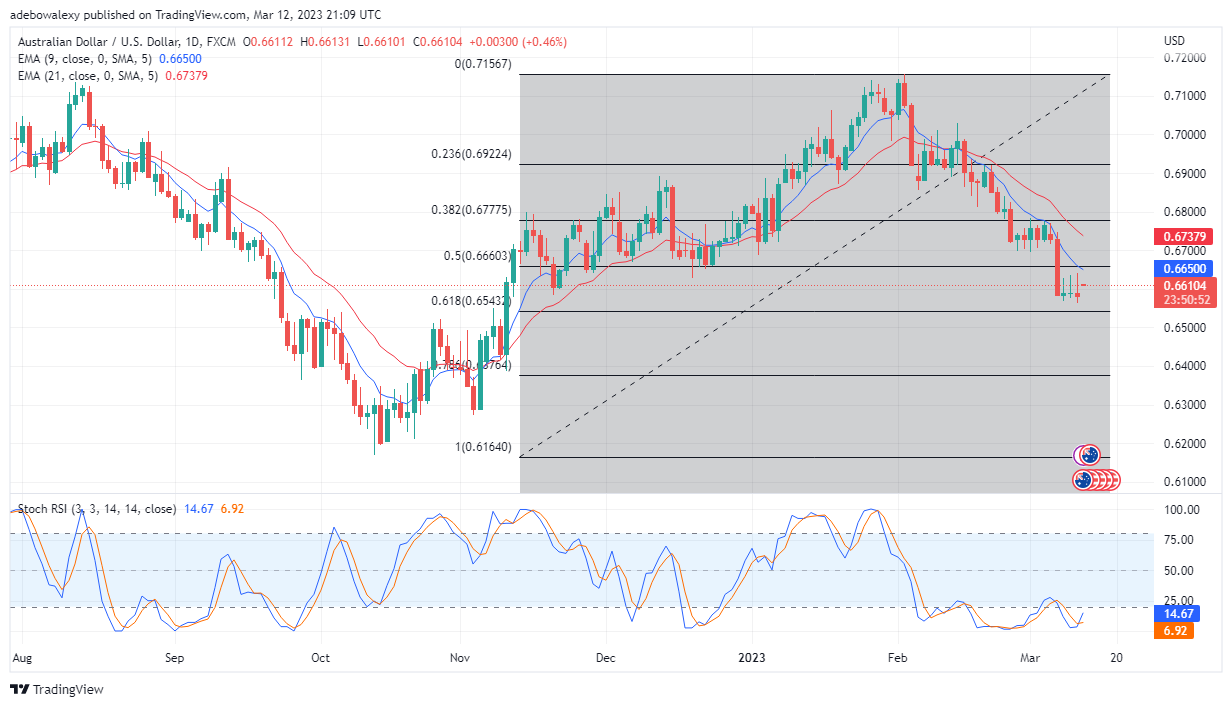
The pair started a price downtrend around February 2nd, after hitting as high as the 0.7100 mark. Price has continued to tear down the resistance level since then and now seems unready to reverse this trend.
Major Price Levels:
Top Levels: 0.6650, 0.6700, and 0.6750
Floor Levels: 0.6600, 0.6570, and 0.6550

AUD/USD Attempt to Attack the 0.6660 Mark Failed
In the ongoing session, the AUD/USD price seems to have tried to retrace the resistance at the 0.6660 mark. However, this attempt failed, as a red dash price candle now appears for this session. Despite this, the lines of the Stochastic RSI maintain their upside bearing, after an upside crossover in the oversold zone. The RSI display may be coming from the fact that the last price candle is still positioned higher than the previous one. What such a display shows are that upside forces may still be around in this market. Nevertheless, the session is still young, and more trading activities still lie ahead.

AUD/USD May Retain Its Bearish Characteristics
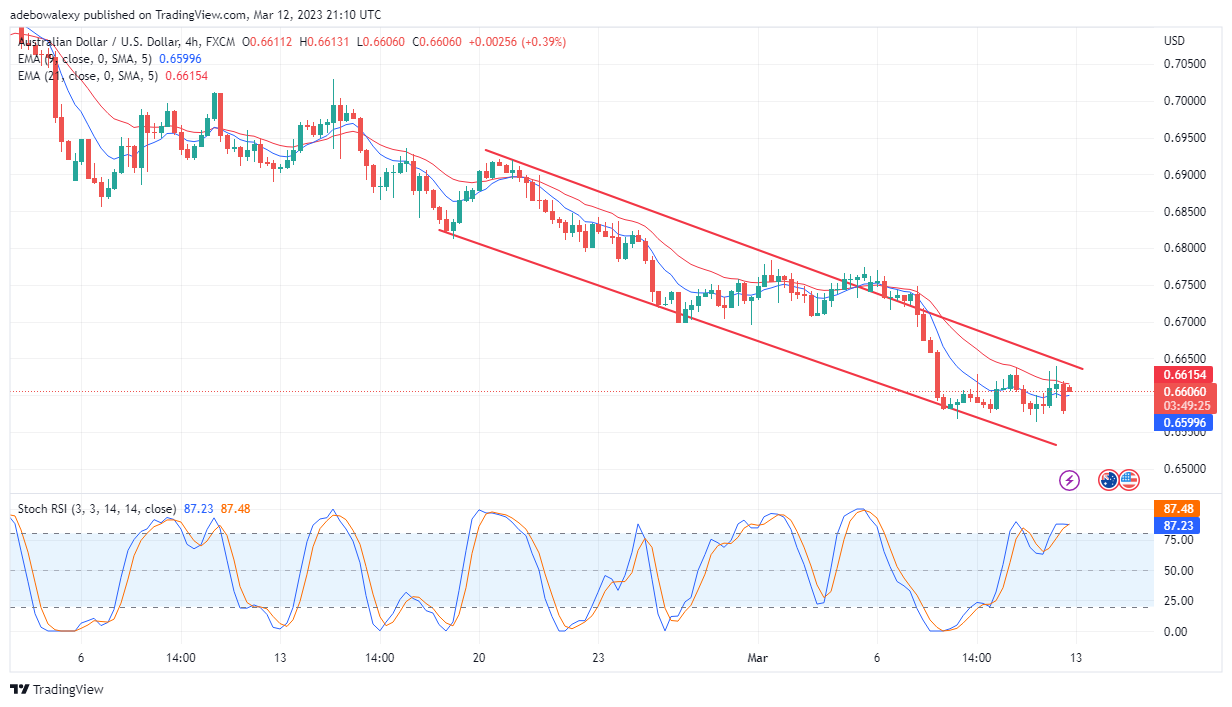
Price action in the AUD/USD 4-hour market has crossed above the 9-day Exponential Moving Average curve. However, since the previous trading session till now, bearish price candles have been appearing in this market. Another red price candle has appeared for the ongoing trading session, and it indicates that headwinds are still in control. Nevertheless, just like on the daily market, the last price candle here too formed higher than the previous one. Also, this price candle took the price above the 9-day EMA curve. Meanwhile, the RSI indicator curves are now touching at the tip in what seems like an attempt for a downward crossover above the 75 levels. The price direction here still appears more like a probability, so traders can place an entry at 0.6640. This will keep them out if a headwind continues to develop, and prices fall lower.
Do you want to take your trading to the next level? Join the best platform for that here.


Leave a Reply