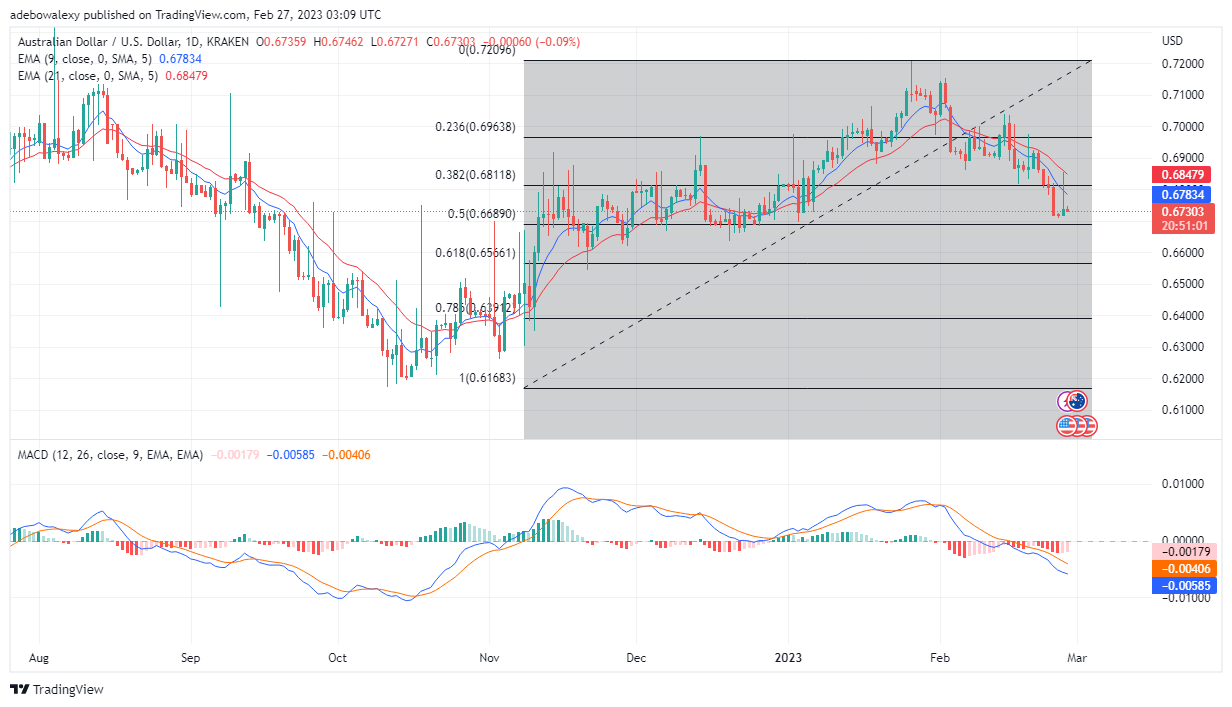
The AUD/USD price action has been on a downtrend since February 2nd. The bears have stayed on in this market, and this has caused the pair to witness a massive price decline. Even at this point, price action seems ready to fall lower based on signs coming from the technical indicators, used in the analysis of this market.
Major Price Levels:
Top Levels: 0.6750, 0.6770, and 0.6790
Floor Levels: 0.6730, 0.6710, and 0.6690

AUD/USD May Continue Trading in the Bear Territory
Trading activity in the AUD/USD daily market are occurring in bear territory, and it have been there for quite a while. The EMA curves remains above the price movements, while red price candles are appearing more frequently on this chart than green ones. As a result, this indicates that bulls may have exited the market. Also, the MACD indicator lines can be seen running further downward after crossing below the 0.00 price mark. Also, the bars on this indicator can be seen appearing red and growing taller in the negative direction. By all indications, it could be assumed that the price may continue falling in this market.

AUD/USD Attempt to Retrace the 0.6750 Mark Seems to Have Failed
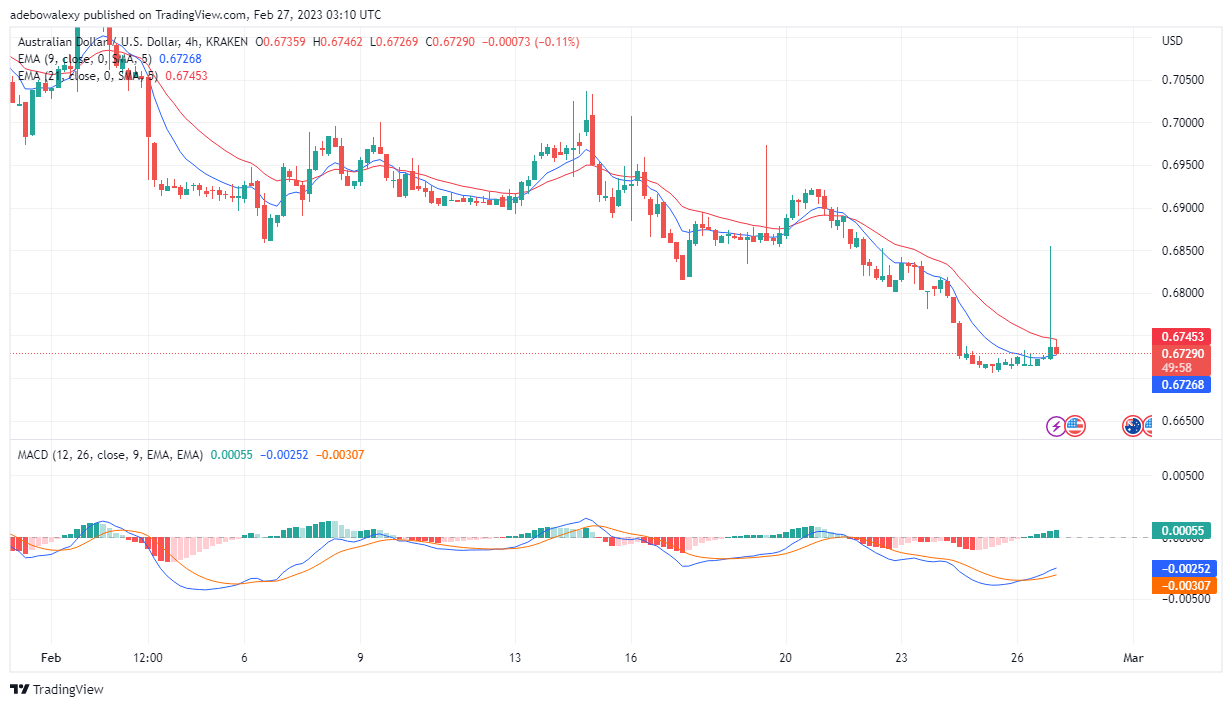
On the AUD/USD 4-hour market, it appears that price action has launched an attempt to retrace toward the resistance of 0.6750. Nevertheless, this attempt seems to have started failing already. This could be seen as a red price candle showed up on this chart shortly after price action crossed above the 9-day EMA curve. Also, the MACD lines are now coursing upwards and towards the 0.00 level, while remaining at a considerable distance below this level. Although, activities on this chart seem to offer some upside hopes, yet traders will have to exercise patience to see if the price action will cross above the 21-day EMA line as well. This will bring some assurance that the AUD/USD price may retrace the 0.6770 price level.
Do you want to take your trading to the next level? Join the best platform for that here.


Leave a Reply