The greenback appears to have experienced a moderate recovery in the current session as the market anticipates the upcoming U.S. inflation data. This has led to a slight downward shift in the AUD/USD market. Let’s take a closer look.
Key Price Levels:
Resistance Levels: 0.6600, 0.6700, and 0.6800
Support Levels: 0.6500, 0.6400, and 0.6300

AUD/USD Faces Early Rejection
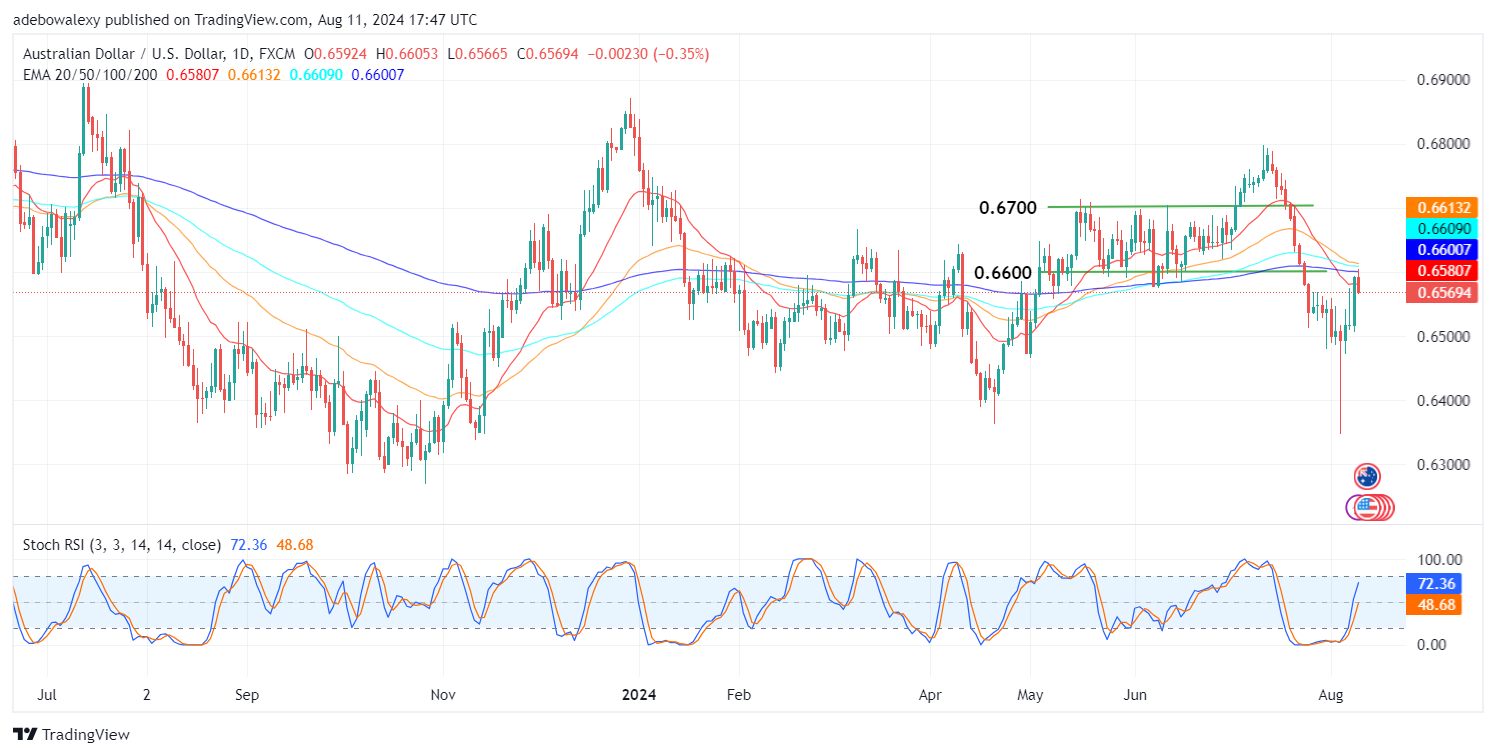
The AUD/USD market has seen a moderate downward retracement on the daily chart. This occurred as soon as the market moved above the 20-day Exponential Moving Average (EMA). The U.S. dollar seems to have gained some strength against the Australian dollar, causing a shift in market sentiment.
Currently, the pair has resumed trading below all the EMA curves on the chart. Meanwhile, the Stochastic Relative Strength Index (SRSI) lines can be seen maintaining an upward trajectory despite the downward retracement, likely due to the significant gains observed in the previous session.

AUD/USD Downward Retracement May Continue
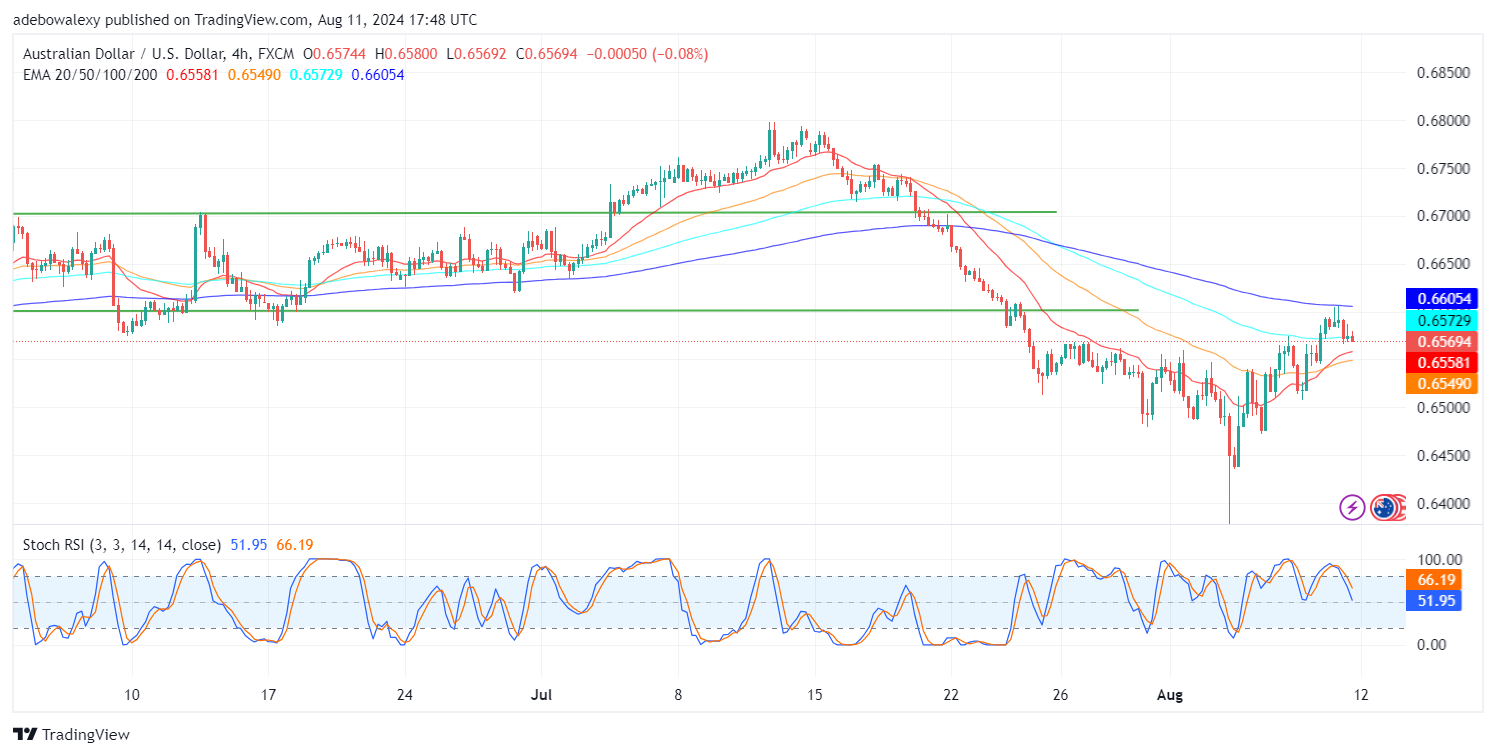
The 4-hour chart for AUD/USD reveals that the ongoing downward retracement has pushed the market below the 100-day EMA. At this point, the price action is now situated between the EMA curves on this chart. Additionally, the SRSI indicator lines are extending downward toward the 50 mark, suggesting that the price action may continue its downward retracement.
Nevertheless, traders should monitor the upcoming U.S. inflation data, as it could significantly influence market direction. In the meantime, traders might target the 0.6540 mark.
Do you want to take your trading to the next level? Join the best platform for that here.


Leave a Reply