The Federal Reserve has made it clear that the September rate cut is already on the way. Yet the AUD/USD pair stays pressured and, as a result, holds bearish hopes, according to indications from technical indicators.
Key Price Levels:
Resistance Levels: 0.6600, 0.6700, and 0.6800
Support Levels: 0.6400, 0.6300, and 0.6200

AUD/USD Presents Resistance to Further Downward Corrections
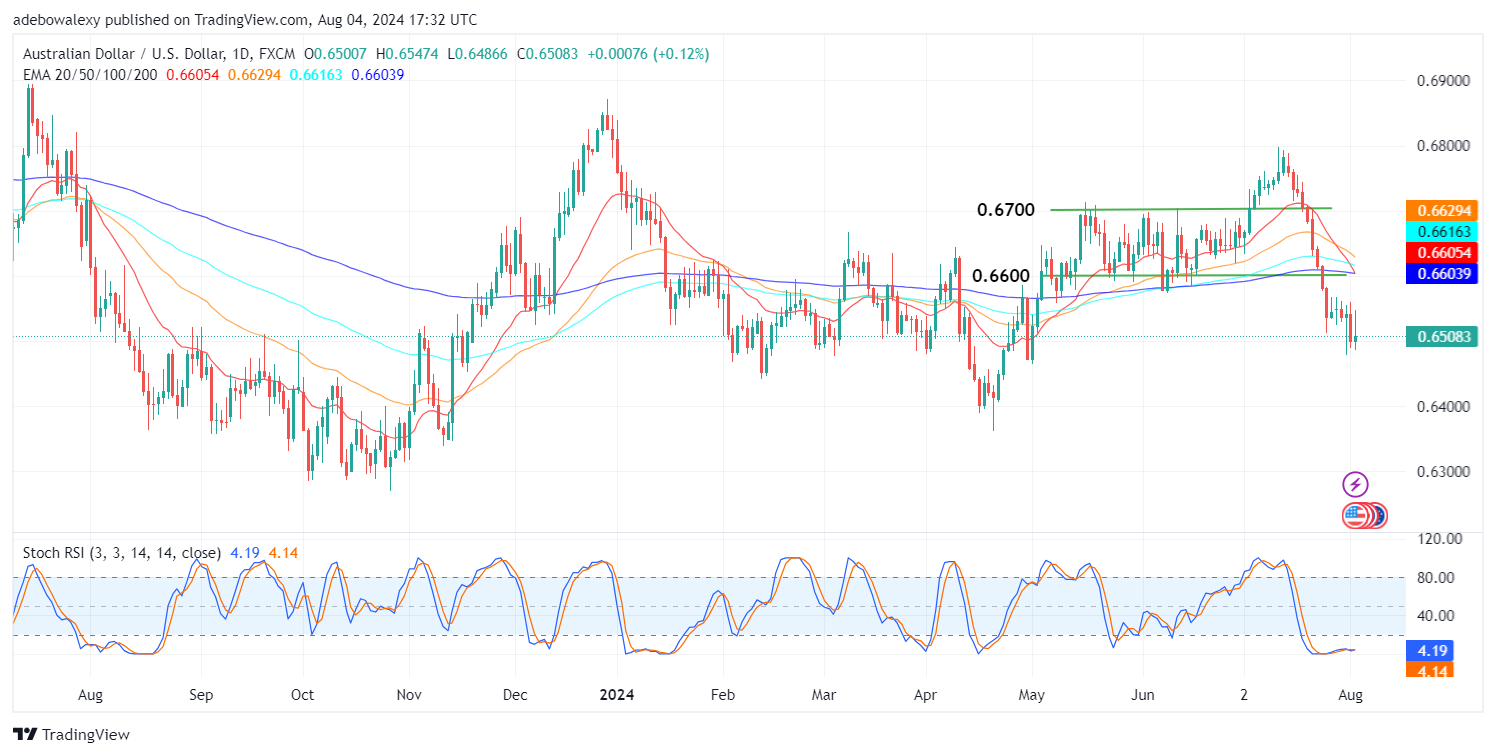
The new week has begun with AUD/USD price action staging what seems like resistance to downward corrections. The corresponding price candle appears off the 0.6500 mark. However, the appearance of its upper shadow reveals that downward forces have staged a significant contraction in the session.
The 20- and 200-day Exponential Moving Average (EMA) lines are converging above price movements. As a result, the Stochastic Relative Strength Index (SRSI) lines remain in the oversold region.

AUD/USD Maintains a Bearish Trajectory
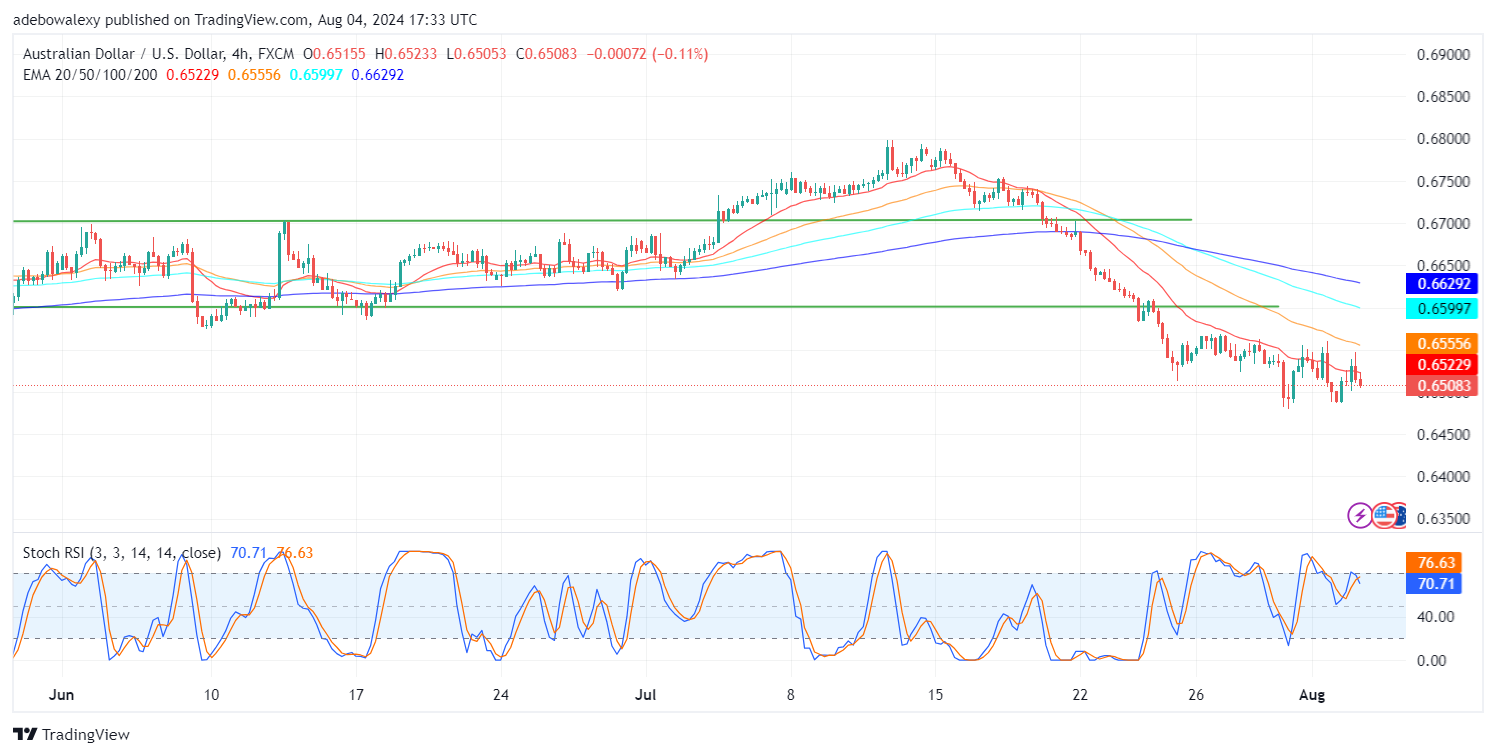
The ongoing trend in the AUD/USD 4-hour market remains below all the EMA indicator lines. Additionally, the red price candle and its upper shadow suggest that downward forces are in control. Furthermore, the SRSI indicator lines have delivered a crossover just below the 80 mark.
This aligns with the current market trajectory, supporting further downward corrections in price action. The downward retracement may continue towards the 0.6450 mark should upcoming Australian economic data fail to impress. Traders should monitor these relevant fundamentals for more cues.
Do you want to take your trading to the next level? Join the best platform for that here.


Leave a Reply