AUD/USD Price Prediction – May 22
In recent times, the AUD/USD market experienced a significant decline in its valuation. The currency pair price now swings upward for recovery as it is still seen under a bearish trading setting between 0.7073 and 0.7002 trade points, maintaining a minute negative percentage rate of 0.10.
AUD/USD Market
Key Levels:
Resistance levels: 0.7200, 0.7300, 0.7400
Support levels: 0.6900, 0.6800, 0.6700
AUD/USD – Daily Chart
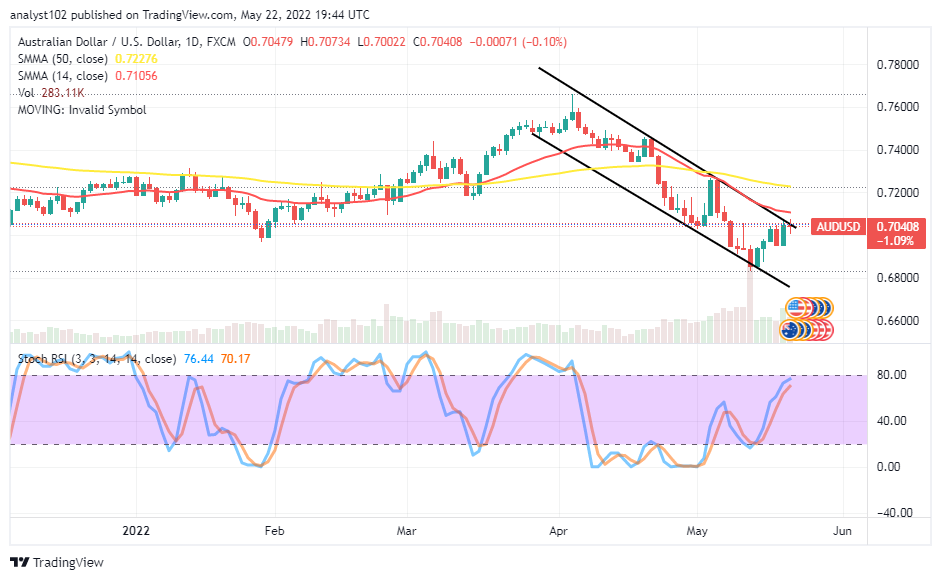
The AUD/USD daily chart reveals the currency pair price swings upward for a recovery underneath the sell signal settings of the SMAs. A line of a sequential bullish candlestick is emanating toward the 14-day SMA indicator below the 50-day SMA indicator. The bearish channel trend lines drew southward to ascertain the market’s boundaries to the downside. The Stochastic Oscillators have moved northbound closer to the range of 80. And they are seemingly attempting to close their lines soon. Will the AUD/USD trade push further northward through the SMAs’ resistances soon?
The possibility of the AUD/USD market pushing northward further through the SMAs’ resistance levels appears dicey. There may soon be around of ranging motions for a while closely under the trading arena of the 14-day SMA. Therefore, while that presumption is materializing, long-position takers are to stay off for some time to avoid bulls’ trap afterward.
On the downside of the technical analysis, the bullish momentum gathering may soon lose the velocity in the near term trading around the points at 0.7000 and 0.7100. The real-time resistance level is around 0.7200. A sudden false breakout around the value point will lead to a downward-returning moment.
The analytics, at a glance, the AUD/USD market operations currently appear, heading toward an overbought trading condition that is liable to give birth to a downward-returning movement from a high point of around the 0.7200 resistance level afterward. AUD/USD 4-hour Chart
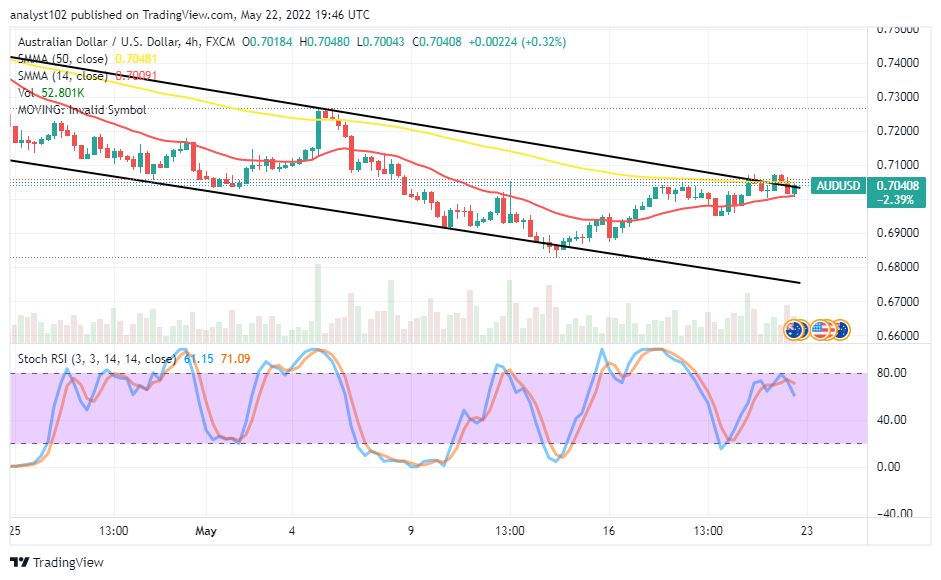
The AUD/USD medium-term chart reveals the currency pair price swings upward for a recovery. Some candlesticks have converged around the positioning area of the SMAs to denote the possibility of the duo coins giving in back to a downward-trending motion in no time. The 14-day SMA has briefly swerved northward closely beneath the 50-day SMA. The Stochastic Oscillators are closer beneath the range of 80, trying to cross their lines southbound. A firm barrier to getting more ups is around 0.7100 and 0.7200.
Note:Forexschoolonline.com is not a financial advisor. Do your research before investing your funds in any financial asset or presented product or event. We are not responsible for your investing results.
Learn to Trade Forex Online
AUD/USD Price Swings Upward for Recovery
Footer

ForexSchoolOnline.com helps individual traders learn how to trade the Forex market
WARNING: The content on this site should not be considered investment advice and we are not authorised to provide investment advice. Nothing on this website is an endorsement or recommendation of a particular trading strategy or investment decision. The information on this website is general in nature so you must consider the information in light of your objectives, financial situation and needs.
Investing is speculative. When investing your capital is at risk. This site is not intended for use in jurisdictions in which the trading or investments described are prohibited and should only be used by such persons and in such ways as are legally permitted. Your investment may not qualify for investor protection in your country or state of residence, so please conduct your own due diligence or obtain advice where necessary. This website is free for you to use but we may receive a commission from the companies we feature on this site.
We Introduce people to the world of currency trading. and provide educational content to help them learn how to become profitable traders. we're also a community of traders that support each other on our daily trading journey
Forexschoolonline.com is not a financial advisor. Do your research before investing your funds in any financial asset or presented product or event. We are not responsible for your investing results.

Leave a Reply