AUD/USD Price Prediction – March 28
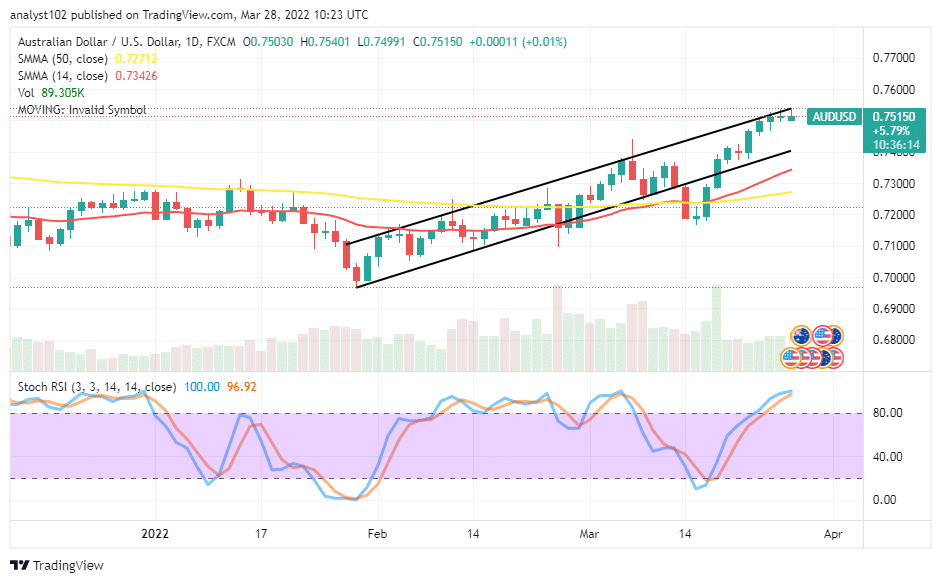
It is observed on the AUD/USD market financial book of records the currency pair price surges further higher through resistance after pushing from the psychological 0.7400. The trade is trading around 0.7515 between the high and the low of 0.7540 and 0.7499, keeping a minute positive percentage of 0.01.
AUD/USD Market
Key Levels:
Resistance levels: 0.7600, 0.7700, 0.7800
Support levels: 0.7400, 0.7300, 0.7200
AUD/USD – Daily Chart
The AUD/USD daily chart shows the currency pair price surges further through resistances. The bullish trend lines drew northwardly above the trend lines of the SMA. The 14-day SMA indicator has crossed the 50-day SMA indicator to the upside. The Stochastic Oscillators are in the overbought region, stretching northbound to indicate that some upward momentums are still in the cards. Will the AUD/USD market bulls push more for profits as the currency pair price surges further higher through resistance?
There has been no visible retarding signal against the current upward momentum-gathering process in the AUD/USD market operations. Based on that report, the currency pair market bulls are likely to push for more profits as price surges further higher through resistance in the current business acts.
On the downside of the technical analysis, the AUD/USD market bears should be wary of exerting a position against the current pace at which the market is trading. It would technically sound ideal for traders to be on the lookout for active reversal motion between 0.7500 and 0.7600 levels before considering the potential of downward trend resumption.
The analytics, at a glance, suggests the AUD/USD market short-position takers should be wary of a sudden re-emergence of a bearish candlestick around the 0.7500 while price tends to fail to push past the 0.7600 resistance in the run.  AUD/USD 4-hour Chart
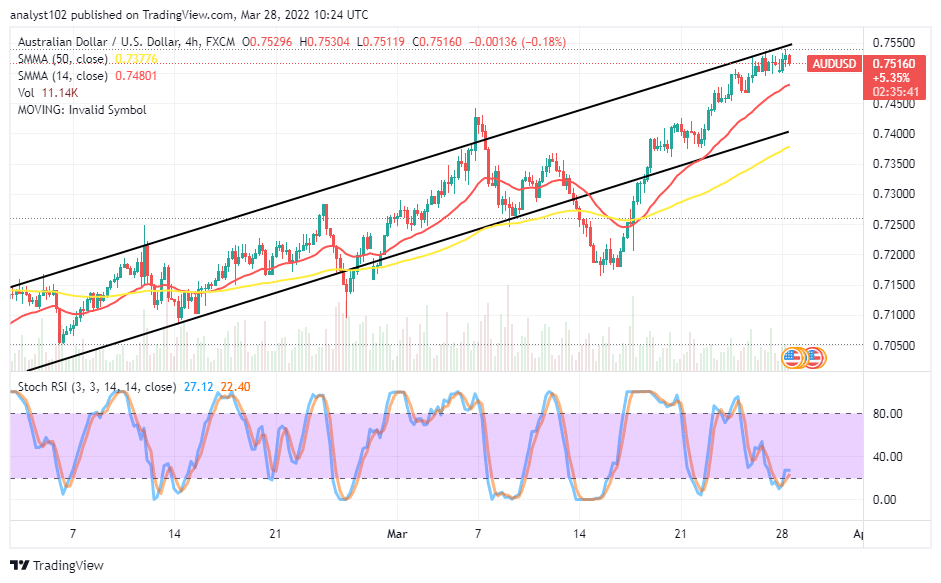
The AUD/USD 4-hour chart showcases the currency pair market price surges further high through resistances. The compilation of variant candlesticks around the upper trend line reveals that long-position takers have been overbearing forces on the impact of the US economy for a while. The 14-day SMA has curved northwardly above the 50-day SMA. The Stochastic Oscillators have moved southbound to locate a position around the range at 20. It still appears the outlook may favor the upside motion for a while. The points between 0.7550 and 0.7600 will serve as integral parts, determining the subsequent direction.
Note:Forexschoolonline.com is not a financial advisor. Do your research before investing your funds in any financial asset or presented product or event. We are not responsible for your investing results.
Learn to Trade Forex Online
AUD/USD Price Surges Further High through Resistances
Footer

ForexSchoolOnline.com helps individual traders learn how to trade the Forex market
WARNING: The content on this site should not be considered investment advice and we are not authorised to provide investment advice. Nothing on this website is an endorsement or recommendation of a particular trading strategy or investment decision. The information on this website is general in nature so you must consider the information in light of your objectives, financial situation and needs.
Investing is speculative. When investing your capital is at risk. This site is not intended for use in jurisdictions in which the trading or investments described are prohibited and should only be used by such persons and in such ways as are legally permitted. Your investment may not qualify for investor protection in your country or state of residence, so please conduct your own due diligence or obtain advice where necessary. This website is free for you to use but we may receive a commission from the companies we feature on this site.
We Introduce people to the world of currency trading. and provide educational content to help them learn how to become profitable traders. we're also a community of traders that support each other on our daily trading journey
Forexschoolonline.com is not a financial advisor. Do your research before investing your funds in any financial asset or presented product or event. We are not responsible for your investing results.

Leave a Reply