AUD/USD Price Prediction – AUGUST 1
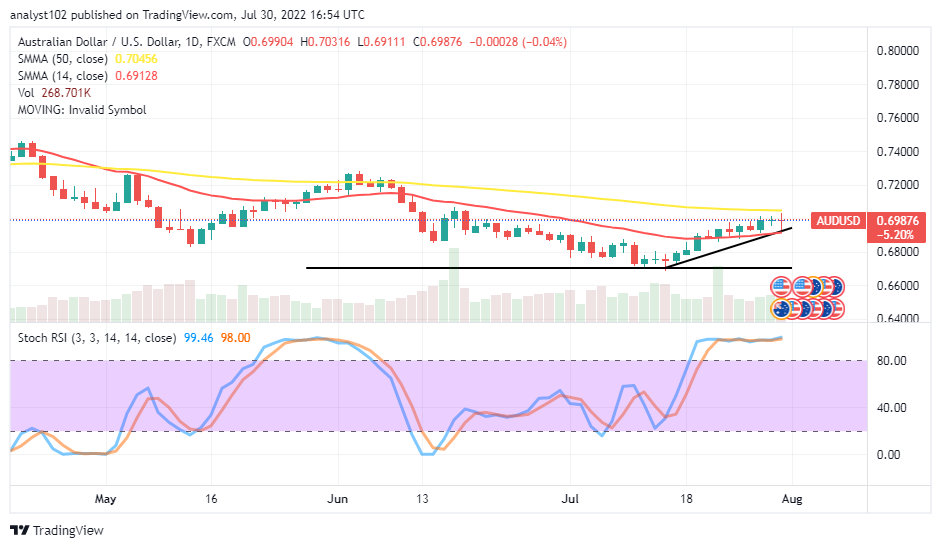
It has been that the AUD/USD market price stretches northward to the 0.7000 resistance trading line as it has been keeping a long-upward swinging motion. The currency pair financial book of records has it that price witnessed a high of 0.70316 and a low of 0.69111 at a minute minimal 0.04 percent negative.
AUD/USD Market
Key Levels:
Resistance levels: 0.7050, 0.7150, 0.7250
Support levels: 0.6850, 0.6750, 0.6650
AUD/USD – Daily Chart
The AUD/USD daily chart showcases the currency pair price stretching northward to 0.7000 near the resistance area of the bigger SMA. The 14-day SMA indicator is at 0.69128 underneath the 50-day SMA indicator, which positions at the 0.70456 resistance point. The shorty-bullish trend line drew from the baseline of 0.6700 to conjoin with the smaller SMA at the end. The Stochastic Oscillators have joined within the overbought region, showing that the price is firmer against declining moves. Will the AUD/USD market surge more sustainably through other higher resistances?
The subsequent trading operations in the AUD/USD market may not witness sustainable positions surging higher through some overhead resistance levels afterward as the price stretches northward to the 0.7000 level. At this point, long-position takers needed to suspend the execution of new buying orders around the bigger SMA.
On the downside of the technical, all seems, getting set for the AUD/USD market bears. Selling forces may soon generate around 0.70456. A sudden hike at the point tends to turn into a correction that can maximally give in back to the downside afterward.
The analytics, at a glance, the overall decision as related to technical thinking supports the AUD/USD market sellers will have the upper hand in the control of the pairing fiat coins, especially if the points of 0.70456 and 0.7050 remain unbroken successfully to the north side. AUD/USD 4-hour Chart
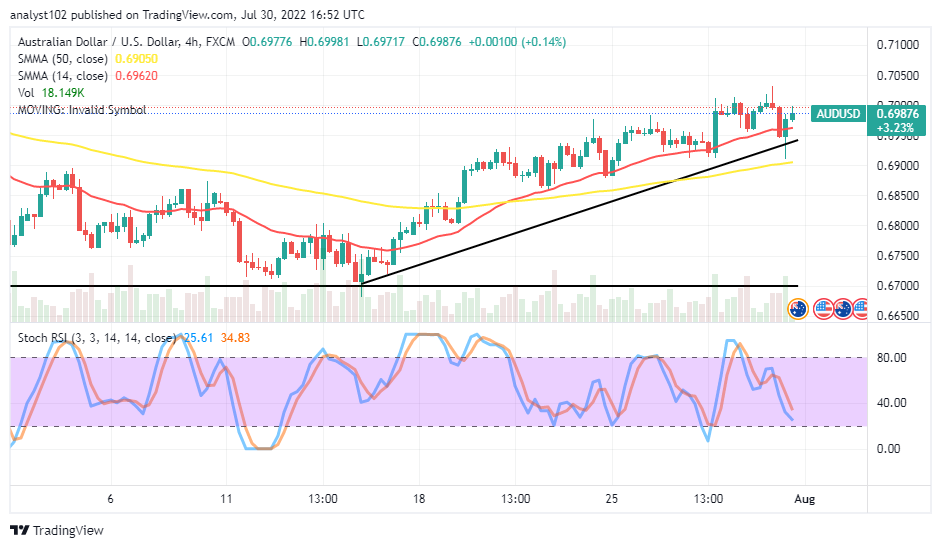
The AUD/USD medium-term chart shows the currency pair price stretches northward to 0.7000. Noticeably, the price managed to push past the value line briefly in recent times. The 14-day SMA indicator is above the 50-day SMA indicator. The Stochastic Oscillators have moved southbound toward the range of 20. And they are still pointing toward the south direction closely over the range value line. On a contrary signal note, a bullish candlestick has featured, which could lead the market to retest a previous high below or around the 0.7050 resistance level before resuming a downward-trending motion.
Note:Forexschoolonline.com is not a financial advisor. Do your research before investing your funds in any financial asset or presented product or event. We are not responsible for your investing results.
Learn to Trade Forex Online
AUD/USD Price Stretches Northward to 0.7000
Footer

ForexSchoolOnline.com helps individual traders learn how to trade the Forex market
WARNING: The content on this site should not be considered investment advice and we are not authorised to provide investment advice. Nothing on this website is an endorsement or recommendation of a particular trading strategy or investment decision. The information on this website is general in nature so you must consider the information in light of your objectives, financial situation and needs.
Investing is speculative. When investing your capital is at risk. This site is not intended for use in jurisdictions in which the trading or investments described are prohibited and should only be used by such persons and in such ways as are legally permitted. Your investment may not qualify for investor protection in your country or state of residence, so please conduct your own due diligence or obtain advice where necessary. This website is free for you to use but we may receive a commission from the companies we feature on this site.
We Introduce people to the world of currency trading. and provide educational content to help them learn how to become profitable traders. we're also a community of traders that support each other on our daily trading journey
Forexschoolonline.com is not a financial advisor. Do your research before investing your funds in any financial asset or presented product or event. We are not responsible for your investing results.

Leave a Reply