AUD/USD Prediction – January 10
The AUD/USD price reverses slightly at 0.7200 as the currency pair worth is yet to make even a minor move in its today’s session. And that has led the market to have 0.71809 as the same value for opening and the current price line. As a result of that situation, the rate of trading percentage is at 0.00.
AUD/USD Market
Key Levels:
Resistance levels: 0.7300, 0.7400, 0.7500
Support levels: 0.7100, 0.7000, 0.6900
AUD/USD – Daily Chart
Today’s AUD/USD trading activity seems not yet moving in any directional outlook as the daily chart showcase that the currency pair price reverses slightly at 0.7200. The 50-day SMA indicator is above the 14-day SMA indicator as the bullish channels drew briefly across them to the north side. The Stochastic Oscillators have moved southbound from the overbought region to touch the range of 20. That suggests that some falling pressures are relatively ongoing in the currency pair business operations. As AUD/USD price reverses slightly at 0.7200, will the currency pair market go more bearish underneath the trend line of the 14-day SMA?
The 14-day SMA trend line now appears to be the yardstick to determine the most probable direction the AUD/USD market may go in the subsequent sessions as the currency pair price reverses slightly at 0.7200. The current trading pattern suggests, an analyst may conclude that stage is getting set to let the US Dollar push for a while until the price finds a support stance.
On the downside of the technical analysis, the AUD/USD short-position takers have to hold their positions firmly against any northward-pushing efforts against the 14-day SMA indicator around 0.7200 in the near time. Therefore, in the wake of achieving that, the market would have to hold beneath the smaller trading tool to allow a bearish trend moving outlook returning.
In summary, in the process of a genuine consolidation moving style closely beneath the 0.7200 trading level, the AUD/USD short-position takers are likely to continue to dominate the driving of the currency pair market once at the expense of long-position takers’ weaknesses afterward. AUD/USD 4-hour Chart
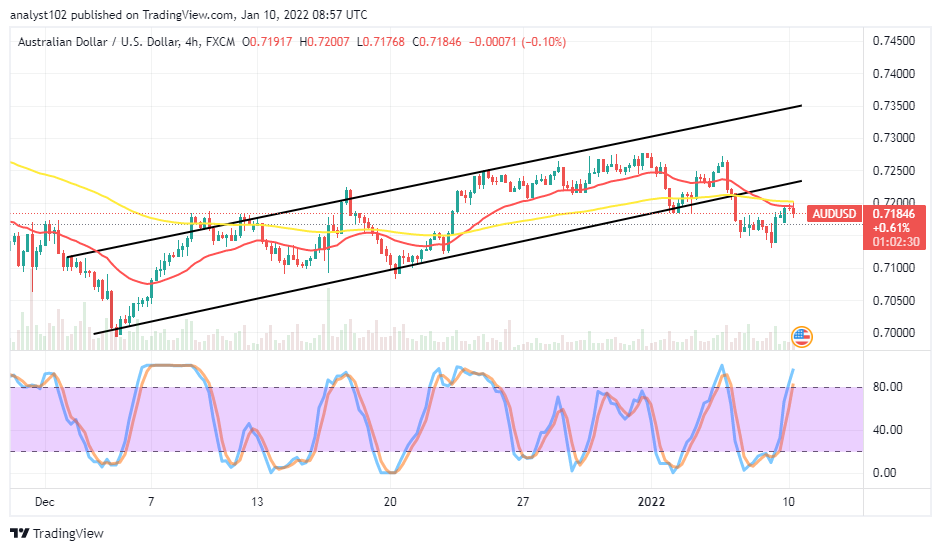
The AUD/USD 4-hour chart reveals that currency pair price reverses at 0.7250 against the daily trading chart. And that gives clarity into the real trading spot where the reversal movement took effect. The 50-day SMA indicator is around 0.7200 as the 14-day SMA has thinly crossed it southward to position tightly beneath. The SMA trend lines are now below the lower bullish trend line. The Stochastic Oscillators are in the overbought region. And a 4-hour bearish candlestick is in the making to signify that a depressive force is imminent in no time. And if that plays out eventually, it means falling forces will prevail until some other subsequent trading sessions.
Note: Forexschoolonline.com is not a financial advisor. Do your research before investing your funds in any financial asset or presented product or event. We are not responsible for your investing results.
Learn to Trade Forex Online
AUD/USD Price Reverses at 0.7200
Footer

ForexSchoolOnline.com helps individual traders learn how to trade the Forex market
WARNING: The content on this site should not be considered investment advice and we are not authorised to provide investment advice. Nothing on this website is an endorsement or recommendation of a particular trading strategy or investment decision. The information on this website is general in nature so you must consider the information in light of your objectives, financial situation and needs.
Investing is speculative. When investing your capital is at risk. This site is not intended for use in jurisdictions in which the trading or investments described are prohibited and should only be used by such persons and in such ways as are legally permitted. Your investment may not qualify for investor protection in your country or state of residence, so please conduct your own due diligence or obtain advice where necessary. This website is free for you to use but we may receive a commission from the companies we feature on this site.
We Introduce people to the world of currency trading. and provide educational content to help them learn how to become profitable traders. we're also a community of traders that support each other on our daily trading journey
Forexschoolonline.com is not a financial advisor. Do your research before investing your funds in any financial asset or presented product or event. We are not responsible for your investing results.

Leave a Reply