AUD/USD Prediction – December 13
Over a couple of trading sessions, the AUD/USD price rallies northward, approaching the 0.7200 resistance line. The currency pair market’s percentage rate is about 0.02, representing a smaller figure to trade around 0.7169.
AUD/USD Market
Key Levels:
Resistance levels: 0.7200, 0.7300, 0.7400
Support levels: 0.7000, 0.6900, 0.6800
AUD/USD – Daily Chart
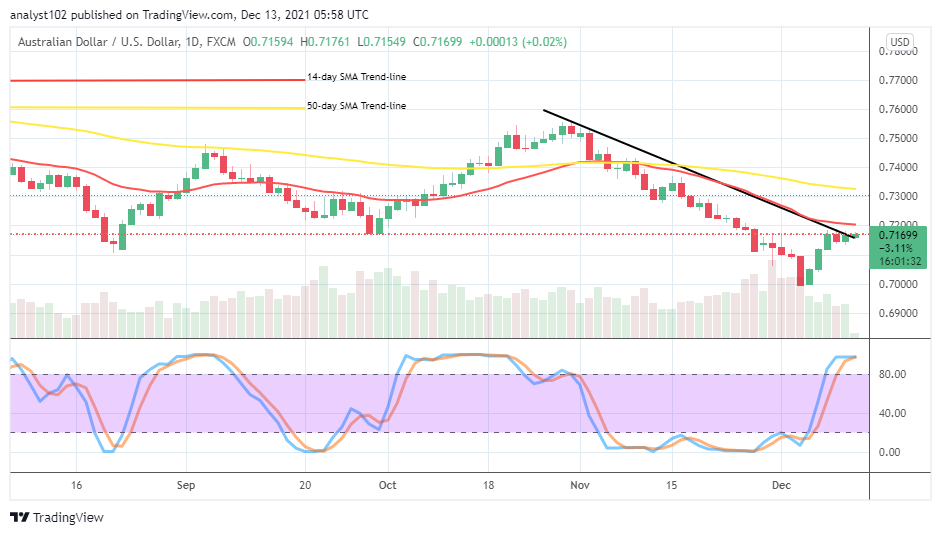
The AUD/USD daily chart shows that the currency pair price rallies northward, approaching 0.7200 resistance level after a long push to the south direction. There have been bullish candlesticks, signifying a notable rebounding motion near the smaller SMA trend line. The 50-day SMA indicator is above the 14-day SMA indicator as the bearish trend line drew to mark the current area of trading resistance near beneath the value-line mentioned above. The Stochastic Oscillators are in the overbought region with closed lines within. That indicates that the market is pausing before taking to the next direction. Will the AUD/USD market push more for recoveries as the currency pair price rallies northward, approaching 0.7200 resistance?
There have been firm indications that the AUD/USD market has again built up a threshold to push for more ups, having been able to set a rebounding motion from around 0.7000 as the currency pair price rallies northward, approaching 0.72000 resistance level. There may soon be a re-occurrence of a slow and steady moving style to push the market into a bullish outlook. Meanwhile, the resistance value-line needed to breach northward forcefully to achieve the presumed upsides.
On the downside of the technical analysis, the AUD/USD market sellers now have to intensify efforts beneath or around the 0.7200 resistance. A bearish candlestick has to form in the market against some preceding bullish candlesticks around 0.7200 and 0.7100 to signal a sell order. Despite the current reading of the Stochastic Oscillators, suggesting an overbought region, traders have to exercise caution at this point while exerting a position order.
Summarily, going by the reading of the Stochastic Oscillators, traders needed to be wary of exerting a position. But, likely, the AUD/USD market pair will still surge higher for more valuation in the subsequent trading operations. AUD/USD 4-hour Chart
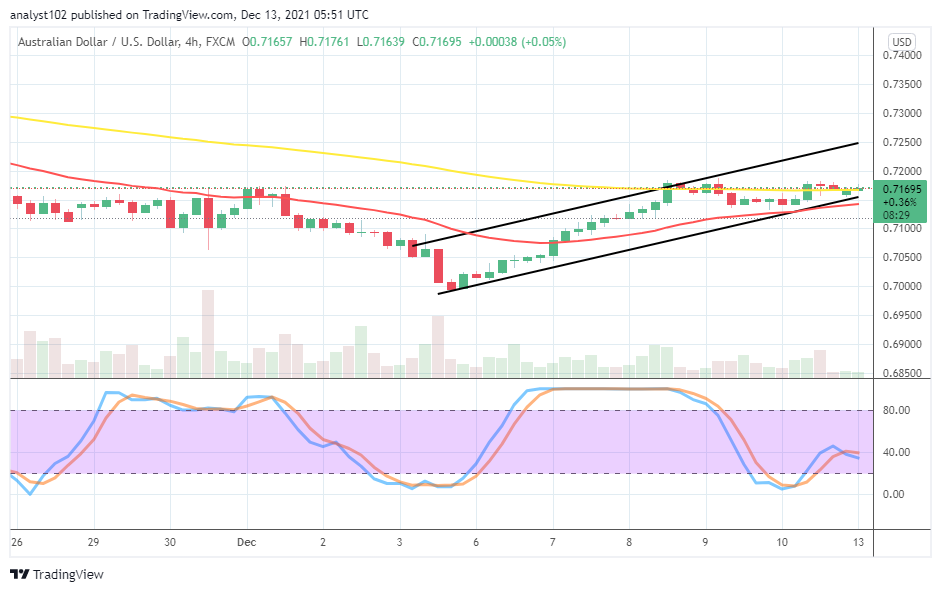
The AUD/USD medium-term chart reveals that the currency pair price rallies into establishing a bullish trend outlook. The bullish channel trend lines drew to ascertain the path the market maintains to the upside. The 50-day SMA indicator is above the 14-day SMA indicator. The Stochastic Oscillators have moved northbound from the oversold region to cross the lines around the range at40. That raises suggestions that the market may witness smaller reversals to allow price to gather more catalyst to push northward afterward.
Note: Forexschoolonline.com is not a financial advisor. Do your research before investing your funds in any financial asset or presented product or event. We are not responsible for your investing results.
Learn to Trade Forex Online
AUD/USD Price Rallies Northward, Approaching 0.7200 Resistance
Footer

ForexSchoolOnline.com helps individual traders learn how to trade the Forex market
WARNING: The content on this site should not be considered investment advice and we are not authorised to provide investment advice. Nothing on this website is an endorsement or recommendation of a particular trading strategy or investment decision. The information on this website is general in nature so you must consider the information in light of your objectives, financial situation and needs.
Investing is speculative. When investing your capital is at risk. This site is not intended for use in jurisdictions in which the trading or investments described are prohibited and should only be used by such persons and in such ways as are legally permitted. Your investment may not qualify for investor protection in your country or state of residence, so please conduct your own due diligence or obtain advice where necessary. This website is free for you to use but we may receive a commission from the companies we feature on this site.
We Introduce people to the world of currency trading. and provide educational content to help them learn how to become profitable traders. we're also a community of traders that support each other on our daily trading journey
Forexschoolonline.com is not a financial advisor. Do your research before investing your funds in any financial asset or presented product or event. We are not responsible for your investing results.

Leave a Reply