AUD/USD Price Prediction – February 21
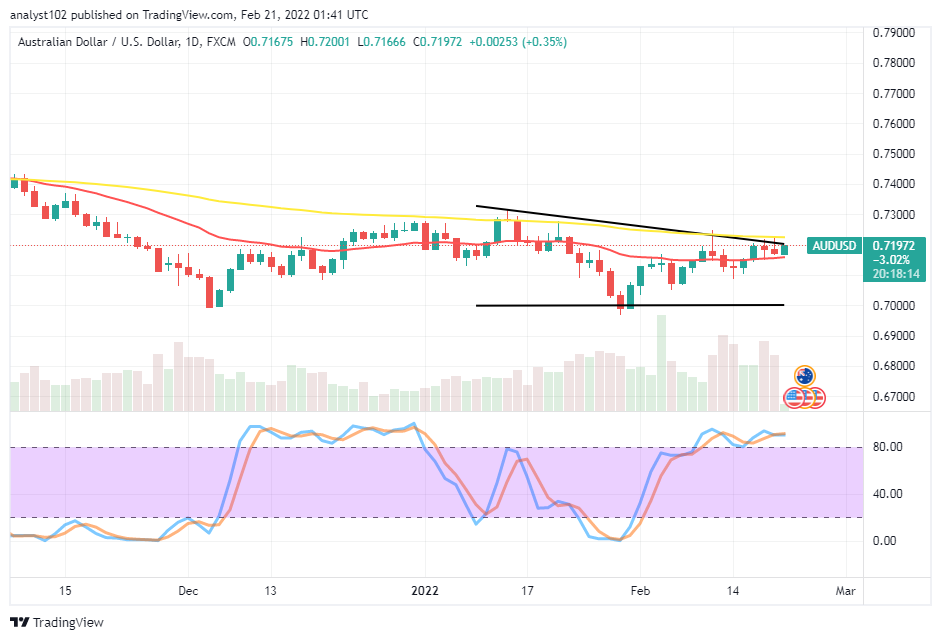
The AUD/USD trading activities at a higher notable transactions spot seem not to have been over as the currency pair price pushes northward, touching 0.7200. With an opening balance point of 0.7167, the market has also witnessed a lower value line of about 0.7166, as it keeps a minute positive percentage of about 0.35.
AUD/USD Market
Key Levels:
Resistance levels: 0.7300, 0.7400, 0.7500
Support levels: 0.7100, 0.7000, 0.6900
AUD/USD – Daily Chart
The AUD/USD daily chart reveals the currency pair price pushes northward, touching 0.7200 level. The bearish trend line drew slightly southward across the bigger SMA trend line at the end to suggest that the current price upsurges is in a resistance zone. The 14-day SMA indicator is beneath the 50-day SMA indicator. The Stochastic Oscillators are in the overbought region, moving in a consolidation style. That means a buying force has to play out in the currency pair transactions for a while. Should traders expect more sustainable upsurges beyond 0.7200 as the AUD/USD market price pushes northward, touching the value-line in question?
Unexpectedly, the AUD/USD market activities will have to maintain sustainable upsurges beyond the 0.7200 line as the price push northward, touching the value line. If the consolidation motion has to hold for a while, the market may reach the 0.7300 resistance before losing back the momentums to the downside.
On the downside of the technical analysis, the AUD/USD market short-position placers have to brace up at this point to spot an active signal reversal of the current price action around the 0.7200 to launch a sell order based on the principle of not over-leveraging a position in their trading approach. It is most likely that the US Dollar will soon regain its stances against the Australian Dollar.
Summarily, the AUD/USD market traders may have to stick around to spot the time that the currency pair price will attempt to make a reversal of its current upsurges to start launching sell orders. AUD/USD 4-hour Chart
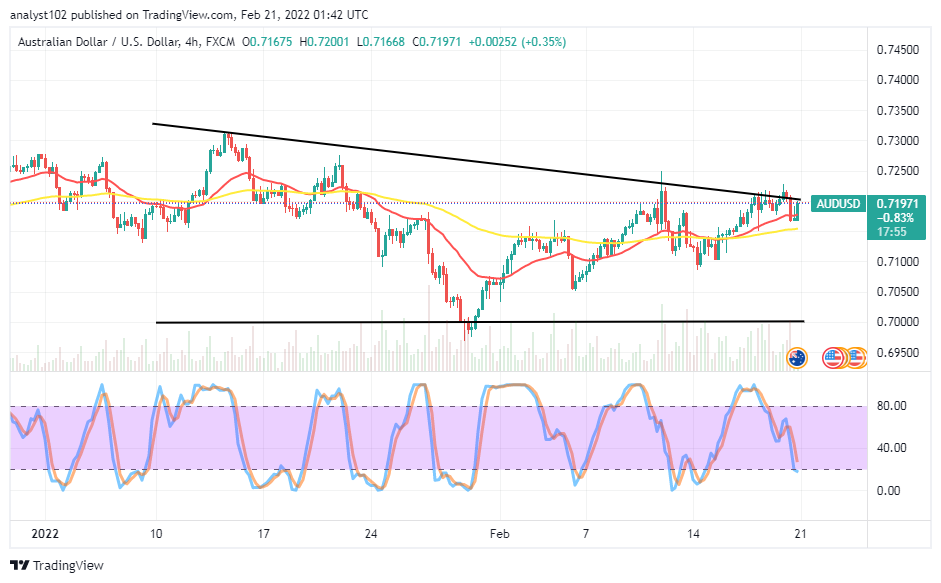
The AUD/USD 4-hour chart showcases the currency pair price pushes northward, touching 0.7200. Initially, the market made a heavy convergence around the value line to showcase how critical the spot will be for an upsurge to stage above it for some time. The 14-day SMA is closely above the 50-day SMA, pointing to the north side. A bullish candlestick is in the making against the same point-line as the bearish trend lines drew to mark down a resistance spot that price presently faces. The Stochastic Oscillators are around the range of 20, signifying the need to exercise some degree of cautiousness before launching a short order at this point.
Note:Forexschoolonline.com is not a financial advisor. Do your research before investing your funds in any financial asset or presented product or event. We are not responsible for your investing results.
Learn to Trade Forex Online
AUD/USD Price Pushes Northward, Touching 0.7200
Footer

ForexSchoolOnline.com helps individual traders learn how to trade the Forex market
WARNING: The content on this site should not be considered investment advice and we are not authorised to provide investment advice. Nothing on this website is an endorsement or recommendation of a particular trading strategy or investment decision. The information on this website is general in nature so you must consider the information in light of your objectives, financial situation and needs.
Investing is speculative. When investing your capital is at risk. This site is not intended for use in jurisdictions in which the trading or investments described are prohibited and should only be used by such persons and in such ways as are legally permitted. Your investment may not qualify for investor protection in your country or state of residence, so please conduct your own due diligence or obtain advice where necessary. This website is free for you to use but we may receive a commission from the companies we feature on this site.
We Introduce people to the world of currency trading. and provide educational content to help them learn how to become profitable traders. we're also a community of traders that support each other on our daily trading journey
Forexschoolonline.com is not a financial advisor. Do your research before investing your funds in any financial asset or presented product or event. We are not responsible for your investing results.

Leave a Reply