AUD/USD Prediction – December 27
The AUD/USD price keeps in recovery channels after notable slight reverses in the last couple of trading sessions. . The currency pair trades averagely around 0.7240 at a smaller positive percentage rate of about 0.24.
AUD/USD Market
Key Levels:
Resistance levels: 0.7300, 0.7400, 0.7500
Support levels: 0.7100, 0.7000, 0.6900
AUD/USD – Daily Chart
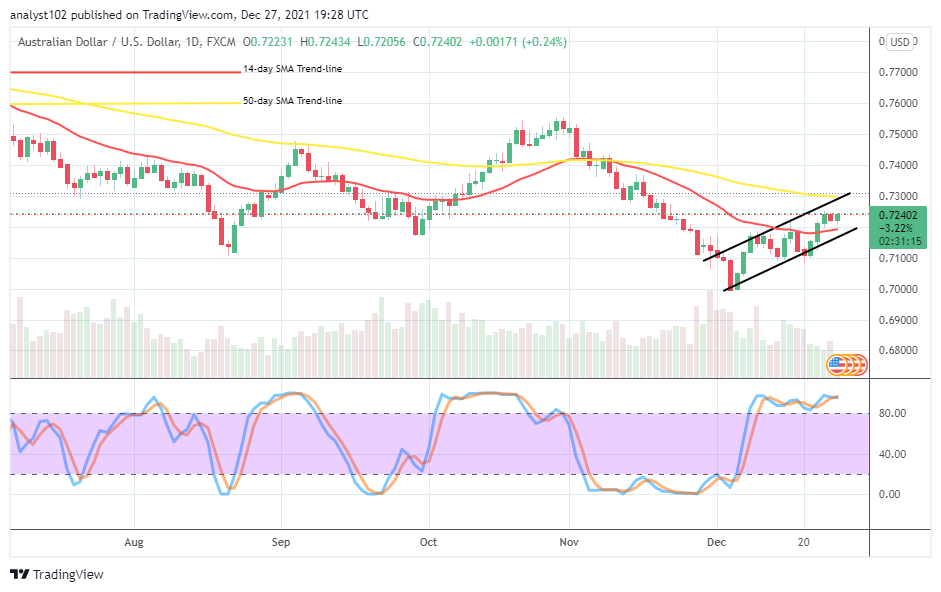
It shows on the AUD/USD daily chart that the currency pair price keeps in recovery channel trend lines after variant candlesticks showcasing a line of price corrections within. There is a psychological range-space between the two indicators as the 14-day SMA trend line is at 0.7200 underneath the 50-day SMA trend line which is at 0.7300 resistance level. The Stochastic Oscillators are in the overbought region, moving in a consolidation style to signify that some upward pressures are in force. Will the AUD/USD market thrive, surging higher more as the currency pair price keeps in recovery channels?
The AUD/USD market has to put more effort to prolong consolidation moving style above the trending level of the 14-day SMA to obtain higher values as the currency pair keeps in recovery channels. The SMA indicator has to serve as the tool to determine an early pivotal support line that price has not to breach fearfully to the downside to allow bulls to run sustainably.
On the downside of the currency pair technical analysis, the AUD/USD bears may have to wait, getting to see a significant resistance trading condition closely near the trend line of the 50-day SMA before deeming it fit to launch a sell order. In the long run of seeing the market pushing down against the zone of the smaller trend line, it means a low point around a previous value will have to revisit afterward.
In summary, traders have to be cautious of their position entering at this time. Despite an indication has had it that the AUD/USD market has reached an overbought trading condition doesn’t mean that price cannot push higher more. AUD/USD 4-hour Chart
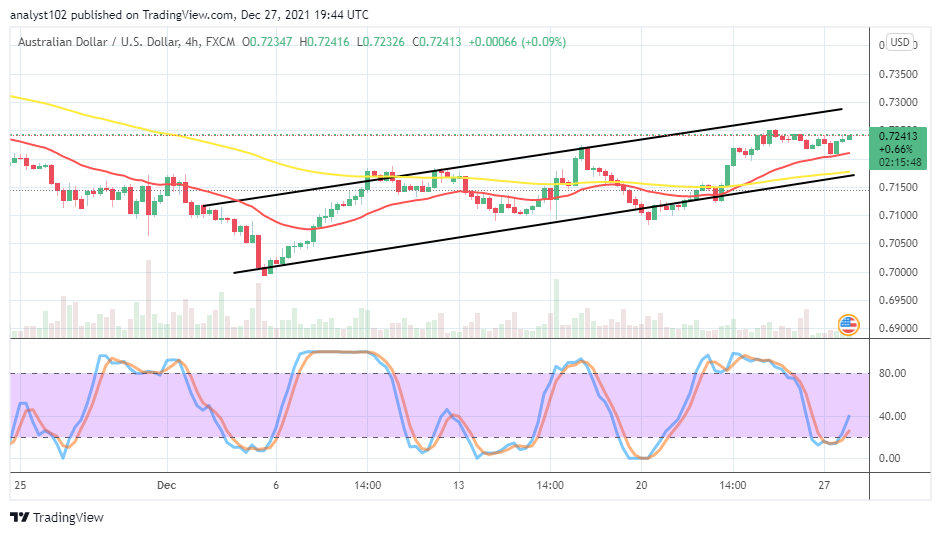
The AUD/USD medium-term chart reveals that the currency pair price keeps in recovery channels. The 14-day SMA trend line is above the 50-day SMA trend line. Several 4-hour candlesticks have formed ups and downs on the buy signal side of the smaller indicator. The Stochastic Oscillators have crossed the lines northbound from the oversold region against the range of 20. That signifies that some buying forces are ongoing. Meanwhile, the key resistance level at 0.7300 is in the waiting. A breakout of it may not achieve for sustainability in the long run.
Note: Forexschoolonline.com is not a financial advisor. Do your research before investing your funds in any financial asset or presented product or event. We are not responsible for your investing results.
Learn to Trade Forex Online
AUD/USD Price Keeps in Recovery Channels
Footer

ForexSchoolOnline.com helps individual traders learn how to trade the Forex market
WARNING: The content on this site should not be considered investment advice and we are not authorised to provide investment advice. Nothing on this website is an endorsement or recommendation of a particular trading strategy or investment decision. The information on this website is general in nature so you must consider the information in light of your objectives, financial situation and needs.
Investing is speculative. When investing your capital is at risk. This site is not intended for use in jurisdictions in which the trading or investments described are prohibited and should only be used by such persons and in such ways as are legally permitted. Your investment may not qualify for investor protection in your country or state of residence, so please conduct your own due diligence or obtain advice where necessary. This website is free for you to use but we may receive a commission from the companies we feature on this site.
We Introduce people to the world of currency trading. and provide educational content to help them learn how to become profitable traders. we're also a community of traders that support each other on our daily trading journey
Forexschoolonline.com is not a financial advisor. Do your research before investing your funds in any financial asset or presented product or event. We are not responsible for your investing results.

Leave a Reply