AUD/USD Price Prediction – May 9
The AUD/USD market price declines further to a lower-trading spot around the 0.7000 point. The currency pair now trades around 0.7004 at a minute negative percentage of 0.94. It appears the trading activities between the two fiat coins are likely to get a sit in the near couple of sessions.
AUD/USD Market
Key Levels:
Resistance levels: 0.7100, 0.2300, 0.7300
Support levels: 0.6900, 0.6800, 0.6700
AUD/USD – Daily Chart
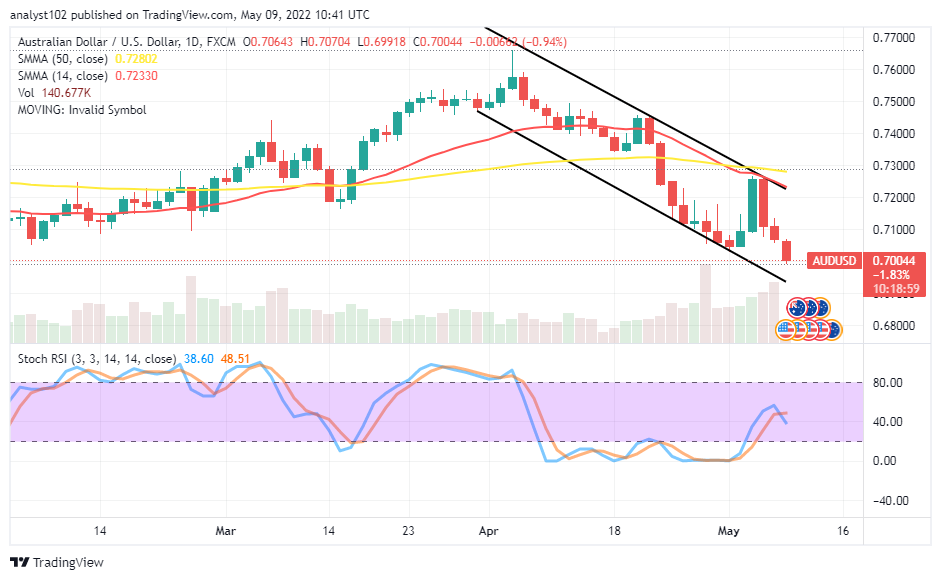
The AUD/USD daily chart reveals the currency pair market price declines further, extending briefly past the 0.7000 trading line during today’s operation. The 14-day SMA indicator has intercepted the 50-day SMA indicator from the top. And they are far above the present trading zone. The Stochastic Oscillators initially swerved northbound from the oversold region to now get crossed southbound between the ranges of 60 and 40. That indicates some downing moves are to still feature in this currency pair transactions.  Will the AUD/USD market lose stance as the currency pair price declines further?
There is still a probability the AUD/USD market will lose stance as already the currency pair price declines further to briefly touch past a lower-trading point of 0.7000. Expectantly, in the near time, the price can breach downward beyond it to find support around the 0.6900 level. But, a bullish candlestick has to emerge for signal confirmation to allow buyers to rebuild a stance along its wall afterward.
On the downside of the technical analysis, the AUD/USD market short-position placers may ride alongside the current downing force with the current bearish candlestick in the market so far it doesn’t give in to a rebounding movement to cause its decimation in the short-term. The moment there is an occurrence of a bullish candlestick in the zones of support points mentioned above, that would mean sellers’ are setting to dowse their efforts in the near possible time.
The analytics, at a glance, as the AUD/USD market may still relatively go down to find a reliable support in the near time especially, when a bullish candlestick re-surfaces at a depth of lower-trading spot afterward.  AUD/USD 4-hour Chart
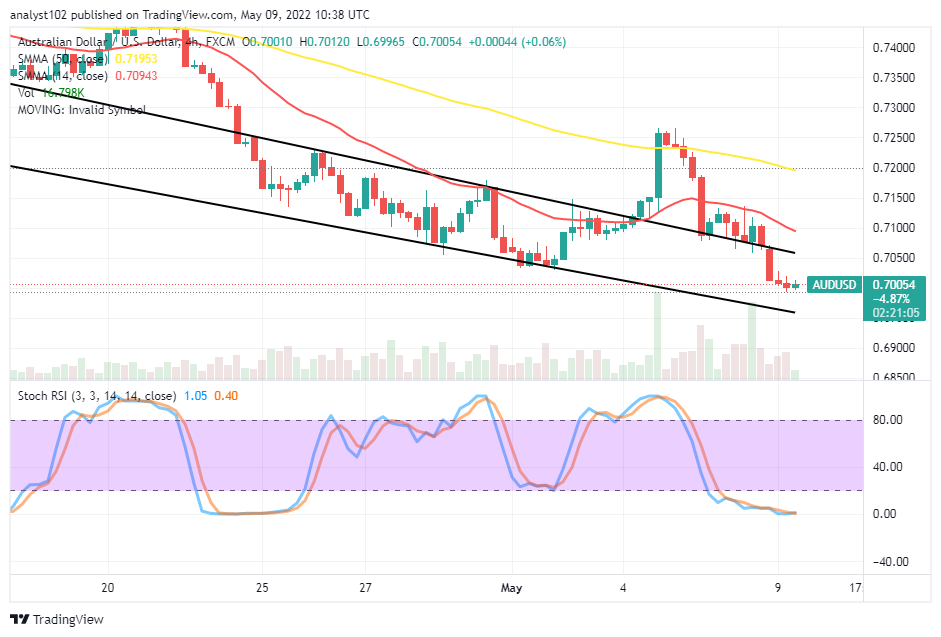
The AUD/USD medium-term chart showcases the currency pair price declines further to consolidate within the bearish channel trend lines drawn. The 14-day SMA indicator is underneath the 50-day SMA indicator. And they are above the bearish channels, indicating the severity of downing forces. The Stochastic Oscillators are in the oversold region, slantingly bending southbound with their lines conjoined. That suggests some falling pressure still dominates the trend until now.
Note:Forexschoolonline.com is not a financial advisor. Do your research before investing your funds in any financial asset or presented product or event. We are not responsible for your investing results.
Learn to Trade Forex Online
AUD/USD Price Declines Further
Footer

ForexSchoolOnline.com helps individual traders learn how to trade the Forex market
WARNING: The content on this site should not be considered investment advice and we are not authorised to provide investment advice. Nothing on this website is an endorsement or recommendation of a particular trading strategy or investment decision. The information on this website is general in nature so you must consider the information in light of your objectives, financial situation and needs.
Investing is speculative. When investing your capital is at risk. This site is not intended for use in jurisdictions in which the trading or investments described are prohibited and should only be used by such persons and in such ways as are legally permitted. Your investment may not qualify for investor protection in your country or state of residence, so please conduct your own due diligence or obtain advice where necessary. This website is free for you to use but we may receive a commission from the companies we feature on this site.
We Introduce people to the world of currency trading. and provide educational content to help them learn how to become profitable traders. we're also a community of traders that support each other on our daily trading journey
Forexschoolonline.com is not a financial advisor. Do your research before investing your funds in any financial asset or presented product or event. We are not responsible for your investing results.

Leave a Reply