AUD/USD Prediction – July 26
The AUD/USD currency price continues declining in the bearish channel trend-lines it set up over a couple of weeks’ sessions. The currency pair’s valuation trades around 0.7346 at a negative percentage rate of about 0.21.
AUD/USD Market
Key Levels:
Resistance levels: 0.7400, 0.7500, 0.7600
Support levels: 0.7200, 0.7100, 0.7000
AUD/USD – Daily Chart
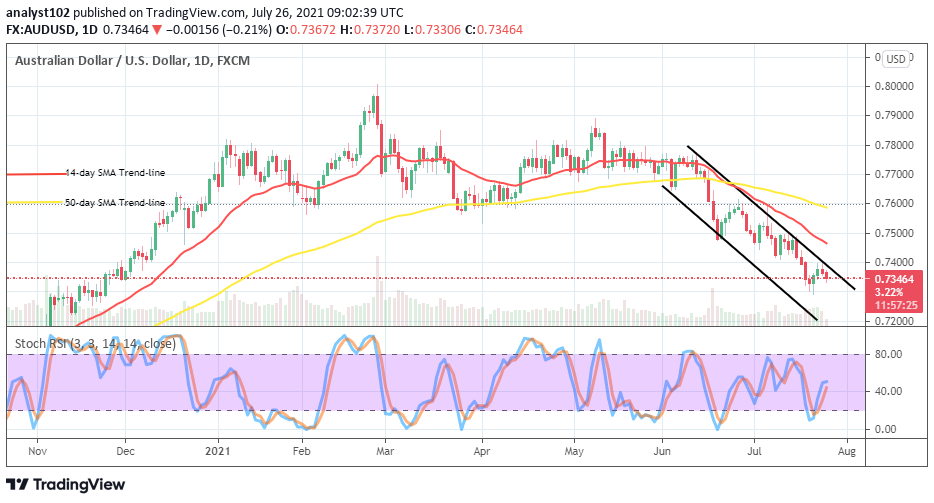
It is depicted on the AUD/USD daily trading chart that the bearish channel trend lines have been instrumental in the current trend that the market keeps as the price continues declining. The SMAs are yet lagging as they are far above the trading zone. The 50-day SMA indicator is over the 14-day SMA indicator. The Stochastic Oscillators have moved upward from the oversold region, attempting to close the lines a bit above the range of 40. And, that could, later on, lead to crossing to the southbound to indicate a continuation motion in the current downward trend of the currency pair’s worthiness. Will there still be an upkeep of the current downtrend by the AUD/USD traders as price continues to decline?
Most of the indicators back the sentiment that the downward force of the currency pair is intact. The market level at 0.7300 had once tested. Most of the indicators back the sentiment that the downward force of the currency pair is intact. The market level at 0.7300 once tested. And, it’s to be breached in the next session so that between it and around the lower at 0.7200, bulls may allow exerting a short line of smaller pull-ups around the upper bearish channel trend line. A sudden spike against the level at 0.7400 may potentially spell an end to the current downward trend.
On the downside analysis, the AUD/USD market bears needed to hold their positions very firm at 0.7400 alongside the bearish channel trend-line. The readings of the Stochastic Oscillators suggest that the currency pair market will still witness a falling pressure in about a few hours to come. Therefore, traders are to stay alert looking out for a price action to back their entry.
Summarily, it appears that the AUD/USD market will have to continually be dominated by bearish force at the expense of bulls’ weaknesses. Therefore, a pull-up that eventually hits a resistance point around the upper bearish channel trend-line will suffice the sell signal that bears may again capitalize. AUD/USD 4-hour Chart
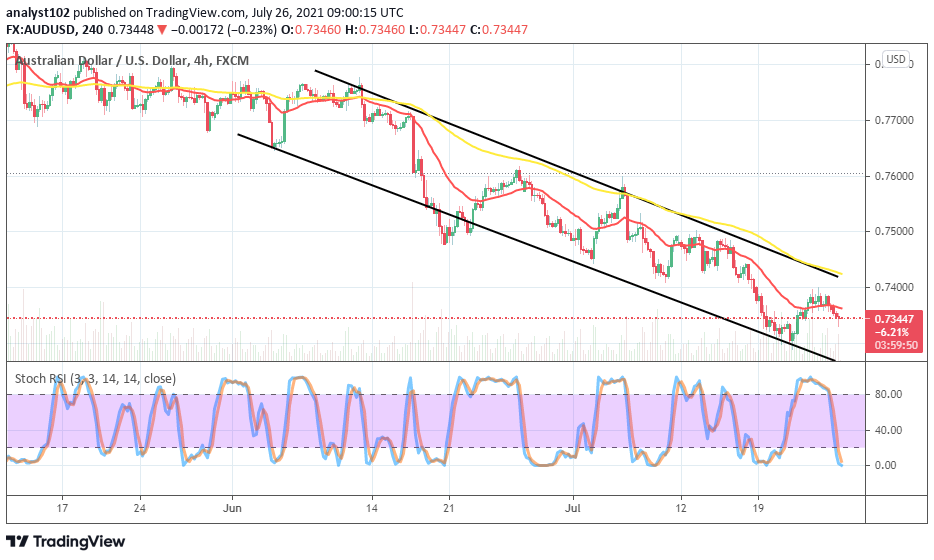
The AUD/USD 4-hour trading chart indicates that price continues declining in the bearish channel trend lines. The upper bearish channel trend-line drew alongside the bigger SMA to locate the higher point that the currency pair’s bulls have been pushing for resistance. The 14-day SMA trend-line is beneath the 50-day SMA trend line as they both point to the south. The Stochastic Oscillators have touched down the lowest range in the oversold region, indicating that prices soon not be pushing southbound strongly for a while. Therefore, traders may stay away from placing further positions for a while.
Note: Forexschoolonline.com is not a financial advisor. Do your research before investing your funds in any financial asset or presented product or event. We are not responsible for your investing results.
Learn to Trade Forex Online
AUD/USD Price Continues Declining
Footer

ForexSchoolOnline.com helps individual traders learn how to trade the Forex market
WARNING: The content on this site should not be considered investment advice and we are not authorised to provide investment advice. Nothing on this website is an endorsement or recommendation of a particular trading strategy or investment decision. The information on this website is general in nature so you must consider the information in light of your objectives, financial situation and needs.
Investing is speculative. When investing your capital is at risk. This site is not intended for use in jurisdictions in which the trading or investments described are prohibited and should only be used by such persons and in such ways as are legally permitted. Your investment may not qualify for investor protection in your country or state of residence, so please conduct your own due diligence or obtain advice where necessary. This website is free for you to use but we may receive a commission from the companies we feature on this site.
We Introduce people to the world of currency trading. and provide educational content to help them learn how to become profitable traders. we're also a community of traders that support each other on our daily trading journey
Forexschoolonline.com is not a financial advisor. Do your research before investing your funds in any financial asset or presented product or event. We are not responsible for your investing results.

Leave a Reply