AUD/USD Prediction – October 5
It observed that the AUD/USD price averages the level at 0.7300 after finding support around 0.7200 lower trading line. The fiat currency pair trades around 0.7271 at a relative negative percentage rate of about 0.17 as of writing. That shows that the base currency isn’t yet to come out of the pressure inflicted on it by the counter currency.
AUD/USD Market
Key Levels:
Resistance levels: 0.7400, 0.7500, 0.7600
Support levels: 0.7200, 0.7100, 0.7000
AUD/USD – Daily Chart
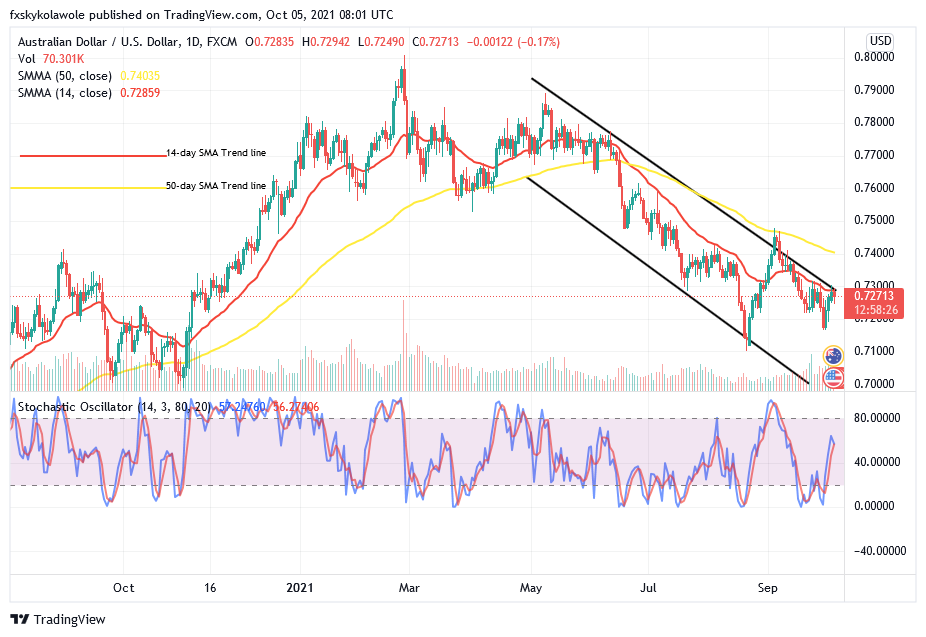
The AUD/USD daily chart reveals that the currency pair price averages 0.7300 trading line as the smaller SMA trend line has touched by a candlestick from beneath. The 50-day SMA indicator is above the 14-day SMA indicator as the bearish channel trend lines drew to get a clearer picture of the trend within which the market maintains. The Stochastic Oscillators have at least moved up at about 60 ranges, trying to close the lines. That can lead to seeing some price slow-motions. Will the AUD/USD market shoot up past 0.73000 as price averages it?
There may not be a shoot-up past the level of 0.7300 in the near time as the price averages it. The upper bearish trend line is close to the 14-day SMA trend line to portend a difficult trading situation in the subsequent price reactions. Lowering the market back to around the level of 0.7200 will possibly create another better supportive stance that the base currency will hedge against its counter-trading instrument.
On the downside, the USD market now has to hold stronger between the levels of 0.7300 and 0.7400 to muster catalyst, countering the subsequent upswing price reactions that AUD market bulls are likely to make around the smaller value-line. A line of pull-ups above the line may allow to place, coupling it a sign of quick active reversal to pave the way to a decent sell entry. Therefore, short-position takers are to be on the alert to avoid late execution.
In summary, it still appears that the downward depression in the AUD/USD market operations has not come to an end. However, the levels between 0.7200 and 0.7100 will be the maximum lower trading zones that the currency pair gets strong supports. AUD/USD 4-hour Chart
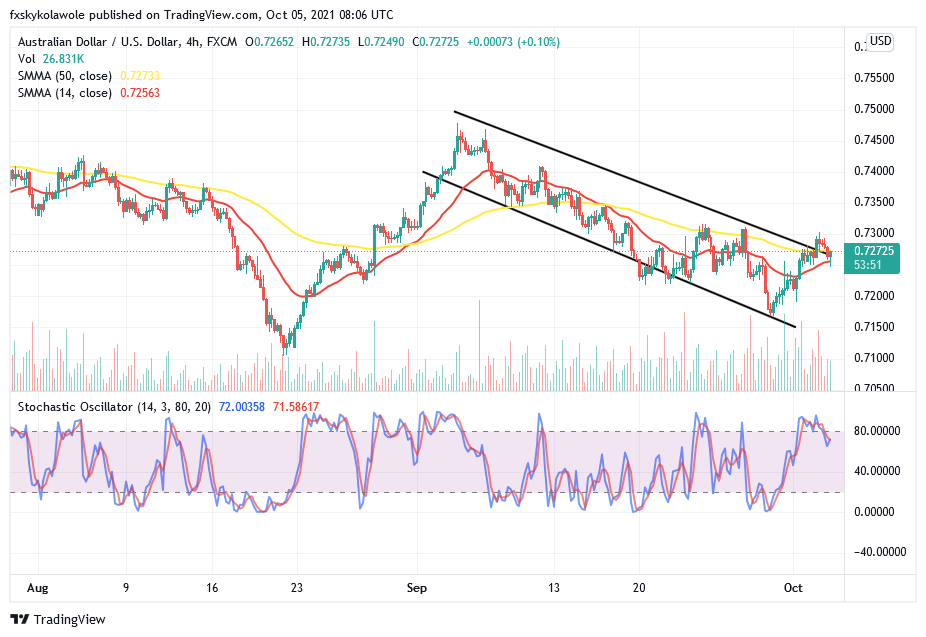
The AUD/USD medium-term chart showcases that price averages 0.7300 level. About a couple of hours back, the price initially touched the point before it currently reverses on a gradual note. The 14-day SMA trend line is underneath the 50-day SMA indicator at a close range. And they both still point toward the south. The Stochastic Oscillators have slightly crossed southbound from the overbought region against the range of 80. That gives an insight that there may soon be some downs featuring.
Note: Forexschoolonline.com is not a financial advisor. Do your research before investing your funds in any financial asset or presented product or event. We are not responsible for your investing results.
Learn to Trade Forex Online
AUD/USD Price Averages 0.7300 Level
Footer

ForexSchoolOnline.com helps individual traders learn how to trade the Forex market
WARNING: The content on this site should not be considered investment advice and we are not authorised to provide investment advice. Nothing on this website is an endorsement or recommendation of a particular trading strategy or investment decision. The information on this website is general in nature so you must consider the information in light of your objectives, financial situation and needs.
Investing is speculative. When investing your capital is at risk. This site is not intended for use in jurisdictions in which the trading or investments described are prohibited and should only be used by such persons and in such ways as are legally permitted. Your investment may not qualify for investor protection in your country or state of residence, so please conduct your own due diligence or obtain advice where necessary. This website is free for you to use but we may receive a commission from the companies we feature on this site.
We Introduce people to the world of currency trading. and provide educational content to help them learn how to become profitable traders. we're also a community of traders that support each other on our daily trading journey
Forexschoolonline.com is not a financial advisor. Do your research before investing your funds in any financial asset or presented product or event. We are not responsible for your investing results.

Leave a Reply