The AUD/USD pair seems to have started the week on a fair note. This is because market activity seems geared towards recovering previous losses. However, we might say it’s too early to make such statements, so let’s zoom in for a closer check.
Important price Levels:
Resistance Levels: 0.6716, 0.6756, 0.6800
Support Levels: 0.6680, 0.6650, 0.6620

AUD/USD Seems to Be Receiving Considerable Long Orders Near 0.6700
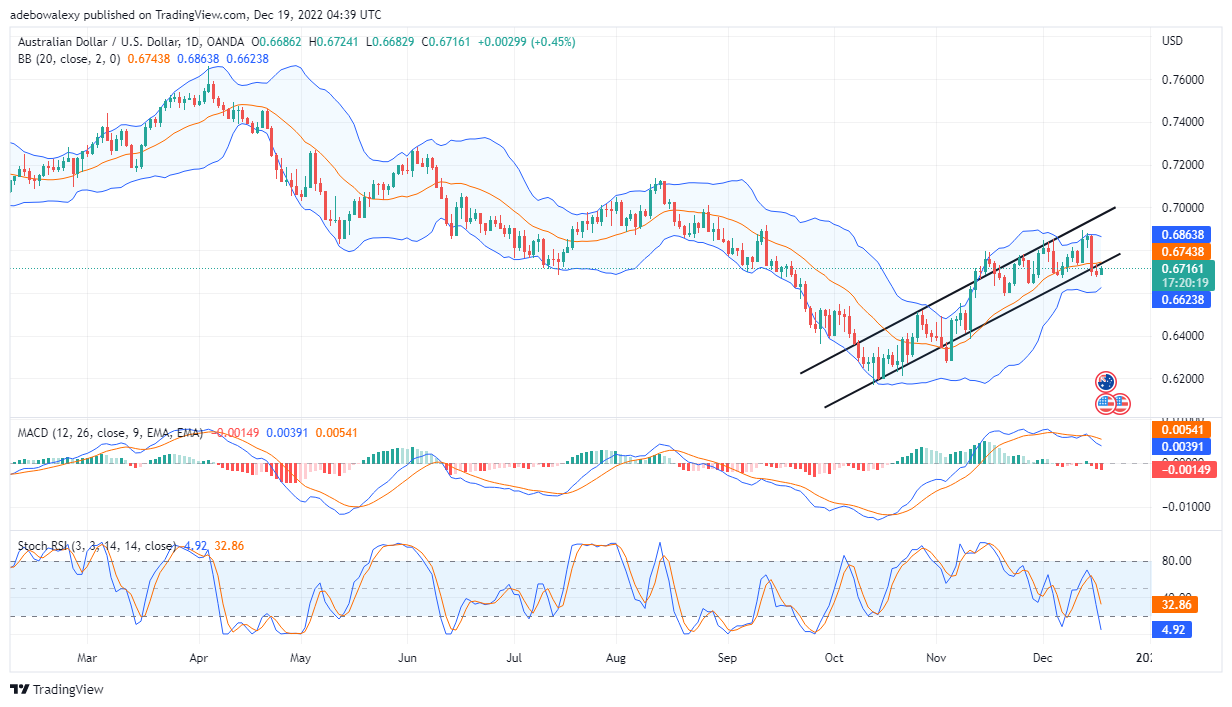
The AUD/USD daily chart reveals that the pair has drawn the attention of buyers, during the opening of this week’s trading session. This can be seen as a green price candle formed to indicate today’s trading session. However, the Stochastic Relative Strength Indicator appears not to have picked up signs of recent buying activities. Also, one can’t say from afar if the MACD Indicator is portraying the recent price activity on this chart. Nevertheless, on close examination, one can perceive that the leading MACD line seems to be making a smooth bend in the sideways direction. The activity of the MACD leading line seems to be indicating a gradual build-up of momentum. Consequently, traders can anticipate that price action may regain the upward-sloping price channel.

AUD/USD Maintains Positivity
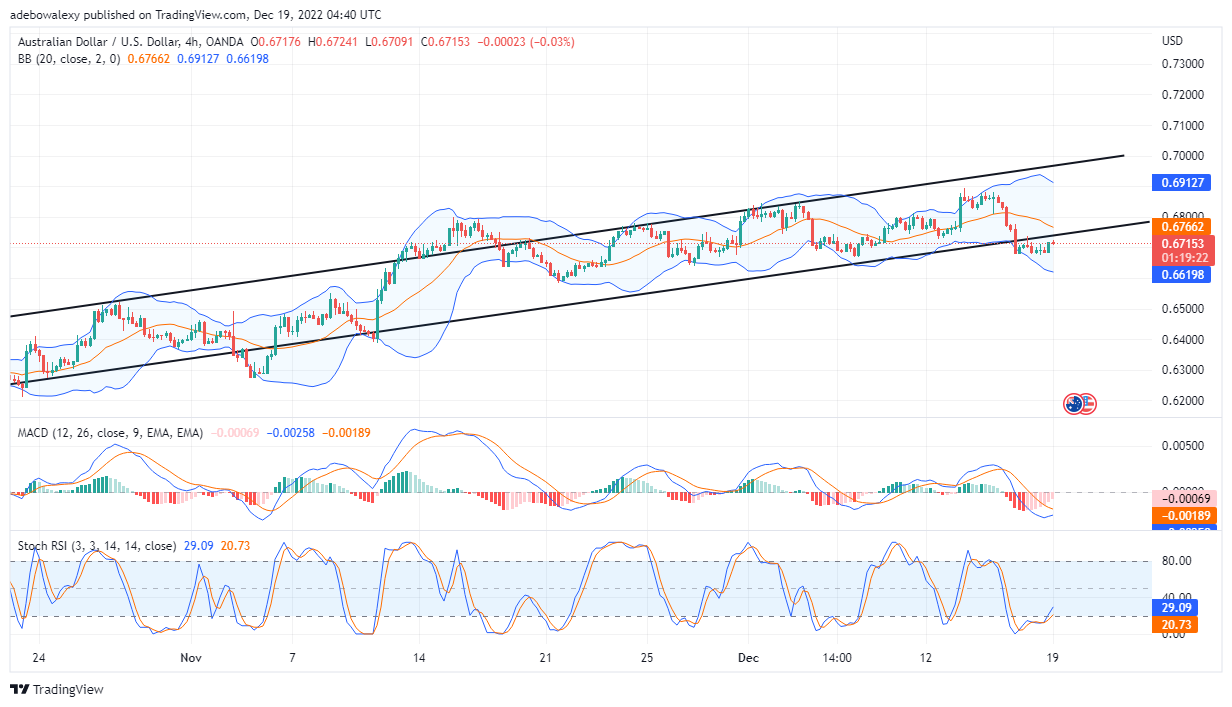
Going by signs emerging from trading indicators, traders in the AUD/USD 4-hour market can still hold on to their upside predictions. The latest price candle here is a bearish one, however, it looks very tiny. Consequently, this makes it have no impact on trading indicators. This can be seen as lines on the RSI indicator continues to rise upwards. Likewise, the MACD lines are now approaching each other for an upside crossover. Despite the latest bearish price candle, price activity can still b said to be maintaining its focus on reclining above the 0.6800 price level shortly. Nevertheless, if the bearish activity becomes significant in this ongoing session, AUD/USD price may fall closer to the 0.6690 level.
Do you want to take your trading to the next level? Join the best platform for that here.


Leave a Reply