AUD/USD Price Prediction – January 24
There have been variant slow-surging motions in the AUD/USD trading activities over a couple of sessions as the currency pair market wallows in recovery trend lines until now. With today’s opening trade balance of 0.7171, the price has witnessed a higher point of about 0.7187, keeping the opening figure as the lower value line, as of writing at a percentage rate of about 0.14 positives.
AUD/USD Market
Key Levels:
Resistance levels: 0.7300, 0.7400, 0.7500
Support levels: 0.7100, 0.7000, 0.6900
AUD/USD – Daily Chart
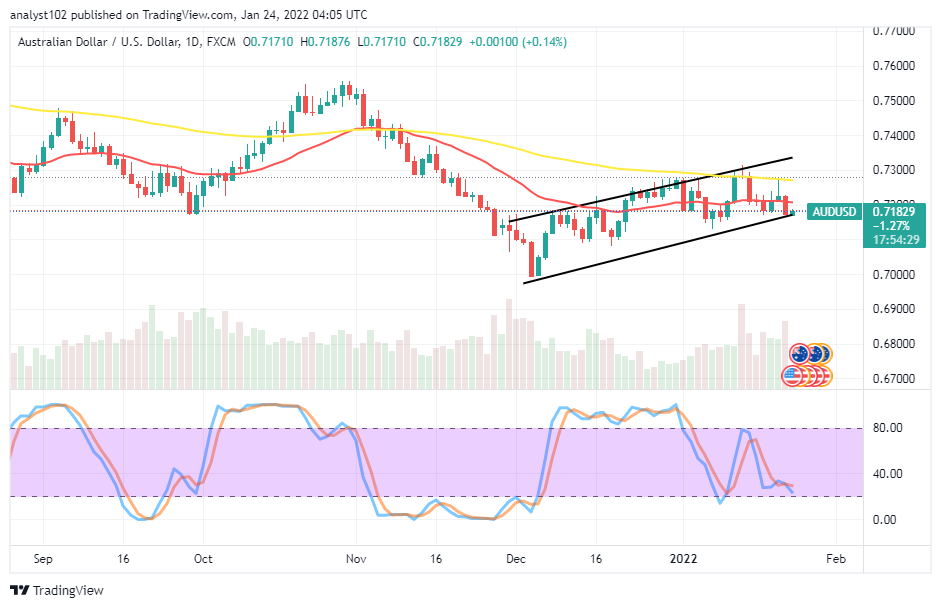
The AUD/USD daily chart showcases the currency pair market wallows in recovery trend lines. The upper bullish recovery channel trend line strategically drew across the SMAs. The 14-day SMA indicator is underneath the 50-day indicator. A trading candlestick is taking a form around 0.7200 to determine the next direction pace of the market where the lower bullish recovery channel trend line is. The Stochastic Oscillators are located closely above the range of 20. That indicates the possibility of the currency pair trade losing more, on a gradual style. Will the AUD/USD trade return more aggressively downing as the currency pair market wallows in a recovery trend?
Being as it is, the AUD/USD trade appears to be putting on a kind of convergences around 0.7300 level to give way to a free fall-off afterward as the currency pair market wallows in a recovery trend presently. It seems to be hard for the market-northward movers to regain their strengths if a sudden breakdown eventually occurs at 0.7200. Therefore, buyers should be wary of their actions at that spot.
On the downside of the technical analysis, the AUD/USD market short-position takers needed to consolidate in their southward-pushing efforts around the trend line of the 14-day SMA. A sudden spike will create another round of the price trying to revisit a resistance spot the 0.7300. In the meantime, the market has seemed sitting around 0.7200, trying to overburden it with depression.
Summarily, less upward energy has featured in the AUD/USD market operations over a couple of sessions. As a result, traders needed to keep looking for when an upward momentum loses out at a higher trading spot before exerting a selling order. AUD/USD 4-hour Chart
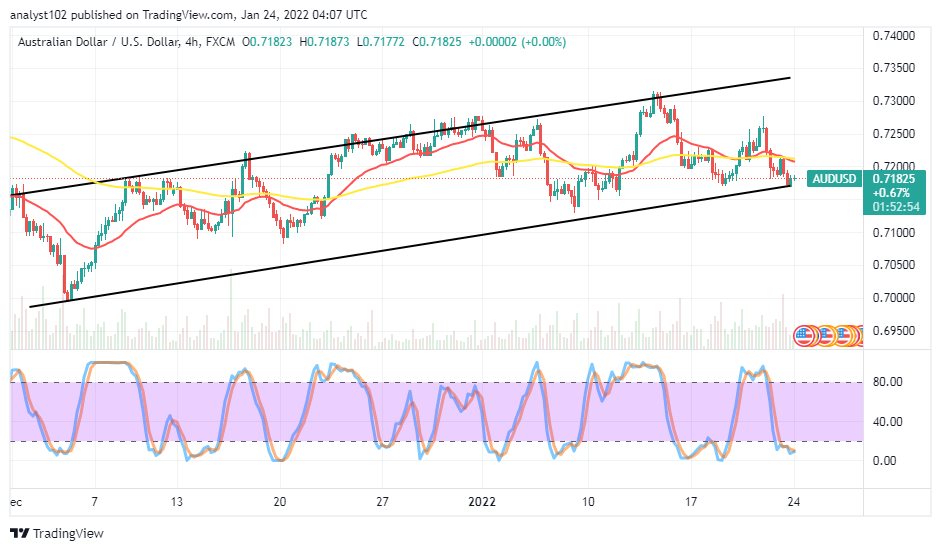
The AUD/USD 4-hour chart reveals the currency pair market wallows in recovery trend lines. The bullish channel trend lines are to embody the SMA indicators. The 14-day SMA trend line has moved southward to align with the 50-day SMA trend line at the top above the current trading situation of the market. The Stochastic Oscillators are in the oversold region with their lines conjoined within it. A smaller bullish candlestick has occurred around the lower bullish trend line to signify the potentiality of seeing the base instrument attempting to make a push against its counter-trading tool. If an upward motion has to be afterward, 0.7150 will have not to breach the south sustainably.
Note:Forexschoolonline.com is not a financial advisor. Do your research before investing your funds in any financial asset or presented product or event. We are not responsible for your investing results.
Learn to Trade Forex Online
AUD/USD Market Wallows in Recovery Trend Lines
Footer

ForexSchoolOnline.com helps individual traders learn how to trade the Forex market
WARNING: The content on this site should not be considered investment advice and we are not authorised to provide investment advice. Nothing on this website is an endorsement or recommendation of a particular trading strategy or investment decision. The information on this website is general in nature so you must consider the information in light of your objectives, financial situation and needs.
Investing is speculative. When investing your capital is at risk. This site is not intended for use in jurisdictions in which the trading or investments described are prohibited and should only be used by such persons and in such ways as are legally permitted. Your investment may not qualify for investor protection in your country or state of residence, so please conduct your own due diligence or obtain advice where necessary. This website is free for you to use but we may receive a commission from the companies we feature on this site.
We Introduce people to the world of currency trading. and provide educational content to help them learn how to become profitable traders. we're also a community of traders that support each other on our daily trading journey
Forexschoolonline.com is not a financial advisor. Do your research before investing your funds in any financial asset or presented product or event. We are not responsible for your investing results.

Leave a Reply