AUD/USD Price Prediction – November 7
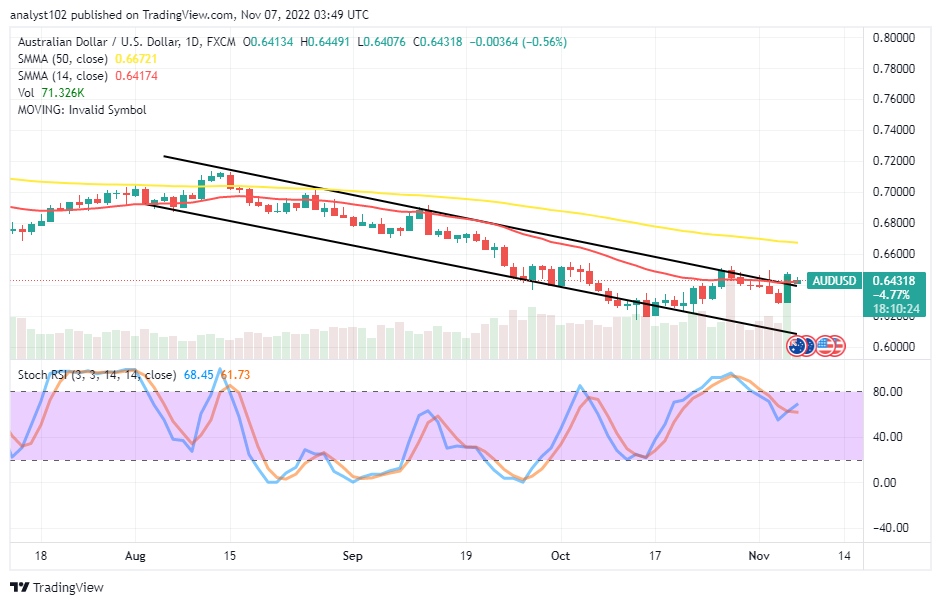
There has been a concurrent bargaining process in the AUD/USD trade operations as the currency pair valuation remains around the 0.6400 line. The transaction process of the pairing coin opens at 0.134 to now trade around 0.64318, maintaining a minute positive percentage rate of 0.56.
AUD/USD Market
Key Levels:
Resistance levels: 0.6500, 0.6600, 0.6700
Support levels: 0.6300, 0.6200, 0.6100
AUD/USD – Daily Chart
The daily chart showcases the currency pair market valuation remains around 0.6400 as the smaller SMA trend line is also around it. The 50-day SMA indicator is at 0.66721, above the 0.64174 value line of the 14-day SMA indicator. The Stochastic Oscillators have moved southbound to a 55 range point. And they have briefly crossed their lines northbound at 61.73 and 68.45 range values. How would traders approach the AUD/USD market’s current trading environment?
As the market valuation remains around 0.6400, the traders’ approach in the current AUD/USD market operation will use lower trading charts. A 4-hour and a 1-hour complimenting each other in the reading overbought condition will signify that buyers need to desist from launching a new buying order.
On the technical downside, bulls’ weaknesses to push northward farther away from the trading zone of the 14-day SMA appear realistic once a bearish candlestick emerges around the indicator. A good shorting entry order will achieve a price that tends to pull up falsely closely over the trend line of the smaller SMA.
A short glance at the technical analysis reveals the general conclusion that the AUD/USD market bears are circling the 14-day SMA’s value of 0.64174. AUD/USD 4-hour Chart
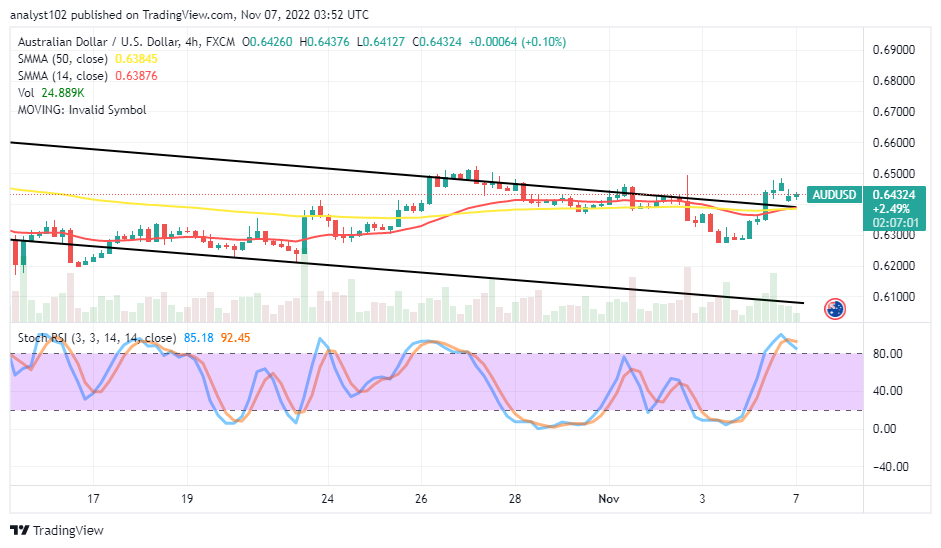
The medium-term AUD/USD chart reveals the currency pair market valuation remains between 0.6400 and 0.6500 points over the trend lines of the SMAs. The 14-day SMA indicator is at 0.63876, and the 50-day SMA indicator is at 0.63845. The upper bearish trend line closely drew southward over the SMA points. The Stochastic Oscillators have crossed southbound in the overbought region at 92.45 and 85.18 range values. A sustained breakout of resistance over the SMA trading indicators should cause concern for bears.
Note: Forexschoolonline.com is not a financial advisor. Do your research before investing your funds in any financial asset or presented product or event. We are not responsible for your investing results.
Learn to Trade Forex Online
AUD/USD Market Valuation Remains at 0.6400
Footer

ForexSchoolOnline.com helps individual traders learn how to trade the Forex market
WARNING: The content on this site should not be considered investment advice and we are not authorised to provide investment advice. Nothing on this website is an endorsement or recommendation of a particular trading strategy or investment decision. The information on this website is general in nature so you must consider the information in light of your objectives, financial situation and needs.
Investing is speculative. When investing your capital is at risk. This site is not intended for use in jurisdictions in which the trading or investments described are prohibited and should only be used by such persons and in such ways as are legally permitted. Your investment may not qualify for investor protection in your country or state of residence, so please conduct your own due diligence or obtain advice where necessary. This website is free for you to use but we may receive a commission from the companies we feature on this site.
We Introduce people to the world of currency trading. and provide educational content to help them learn how to become profitable traders. we're also a community of traders that support each other on our daily trading journey
Forexschoolonline.com is not a financial advisor. Do your research before investing your funds in any financial asset or presented product or event. We are not responsible for your investing results.

Leave a Reply