AUD/USD Price Prediction – February 14
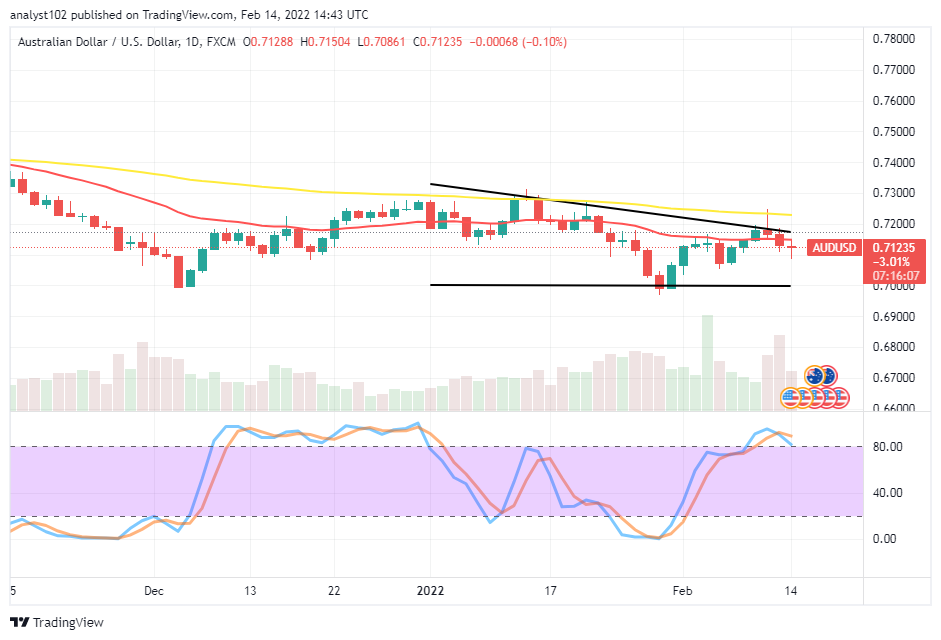
A smaller number of pips lost to the downside as the AUD/USD market trades at 0.7100 in a manner of fluctuating as of writing. The currency pair price opens around 0.7128 to trade between the high and low of 0.7150 and 0.7086 at a minute negative percentage rate of 0.10.
AUD/USD Market
Key Levels:
Resistance levels: 0.7200, 0.7300, 0.7400
Support levels: 0.7000, 0.6900, 0.6800
AUD/USD – Daily Chart
It is currently on the AUD/USD daily chart that the currency pair coin market trades at 0.7100 in a manner of fluctuations around the value-line after a slight southward breach of the smaller SMA trend line. The 50-day SMA indicator is above the 14-day SMA indicator. The horizontal line drawn at 0.7000 support level indicates where the critical line is awaiting the southward-moving process of the bearish trend. The Stochastic Oscillators are in the overbought region with their lines crossed southbound within it closely to the range of 80. Will the AUD/USD price lose the momentums again as the currency [air market trades at 0.7100?
There is a glistering tendency, signaling a brighter chance that the AUD/USD price may still lose momentum further to the downside as the currency pair market trades at 0.7100. However, if long-position takers hold firm by consolidating their stances around the value line, the price may again push back to the up[side for a retest of a higher resistance point around the 50-day SMA.
On the downside of the technical analysis, the AUD/USD market short-position takers now have the greater chance to continue to build upon the current occurrence of a set of bearish candlesticks that have shown up after price hit resistance around the 50-day SMA trend line in a couple of days back.
At a glance, it seems that traders would now have a better chance to short the base currency against the US counter trading coin in the situation, while fake upswings tend to feature in the subsequent transactions. AUD/USD 4-hour Chart
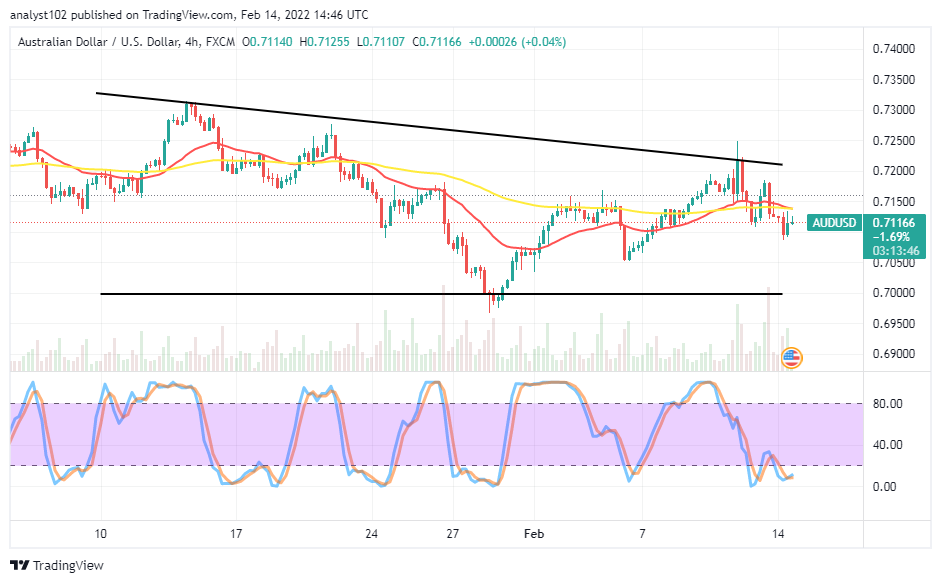
The GBP/USD medium-term chart showcases the currency pair market trades at 0.7100. The bearish trend line drew above the SMAs, showing 0.7200 as the resistance trading zone against the previous northward pressures featured during February 10th trading sessions. The 14-day SMA has slightly crossed southward from the top to touch the 50-day SMA. The Stochastic Oscillators are in the ranges of 40 and zero, seemingly moving in a consolidation style to denote the possibility of price still hovering around 0.7150 and 0.7000 for some more time.
Note:Forexschoolonline.com is not a financial advisor. Do your research before investing your funds in any financial asset or presented product or event. We are not responsible for your investing results.
Learn to Trade Forex Online
AUD/USD Market Trades at 0.7100
Footer

ForexSchoolOnline.com helps individual traders learn how to trade the Forex market
WARNING: The content on this site should not be considered investment advice and we are not authorised to provide investment advice. Nothing on this website is an endorsement or recommendation of a particular trading strategy or investment decision. The information on this website is general in nature so you must consider the information in light of your objectives, financial situation and needs.
Investing is speculative. When investing your capital is at risk. This site is not intended for use in jurisdictions in which the trading or investments described are prohibited and should only be used by such persons and in such ways as are legally permitted. Your investment may not qualify for investor protection in your country or state of residence, so please conduct your own due diligence or obtain advice where necessary. This website is free for you to use but we may receive a commission from the companies we feature on this site.
We Introduce people to the world of currency trading. and provide educational content to help them learn how to become profitable traders. we're also a community of traders that support each other on our daily trading journey
Forexschoolonline.com is not a financial advisor. Do your research before investing your funds in any financial asset or presented product or event. We are not responsible for your investing results.

Leave a Reply