AUD/USD Price Prediction – November 20
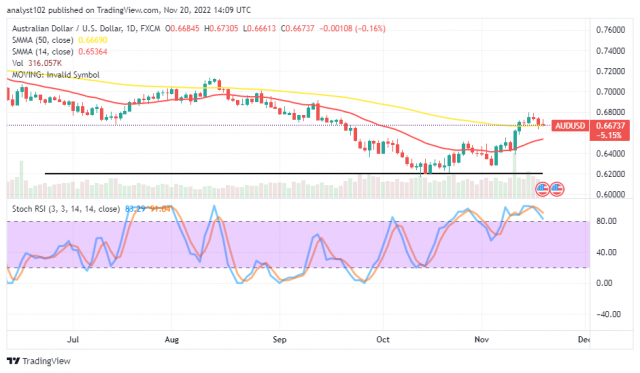
The AUD/USD trade reactions have shown that the currency pair market has set for depression after hitting resistance around the 0.6800 line. Variant transactions have featured between 0.67305 and 0.66613 at an average percentage rate of -0.16.
AUD/USD Market
Key Levels:
Resistance levels: 0.6800, 0.6900, 0.7000
Support levels: 0.6350, 0.6250, 0.6150
AUD/USD – Daily Chart
The AUD/USD daily chart showcases the currency pair market sets for depression around the 0.6800 resistance level. That headline is prompted by double top shadows seen on candlesticks during the trading days of November 15 and 16. The 14-day SMA indicator is at 0.65364, underneath the 0.66690 value point of the 50-day SMA indicator. The Stochastic Oscillators have crossed southbound to 91.04 and 83.29 levels.
Will the AUD/USD market bulls not push firmly back against the 0.6800 resistance?
If there will be a need for the AUD/USD market to push back against the 0.6800 resistance level, it could be to let bulls make up for another round of an upward move completion. Therefore, buyers should be wary of joining gravitational forces while price breaks out around the value line because the situation can cheaply change into a retracement in no time.
On the technical downside, short-position placers now have the turn to be on the lookout for a decent selling entry position as long as the price remains underneath the resistance level of 0.6800. Either a 1-hour or a 4-hour chart will serve as an instrument for getting an ideal time to launch an order.
A short glance at the technical analysis, bears are to take control of the AUD/USD market operations around the 0.6800 resistance trading spot.
AUD/USD 4-hour Chart
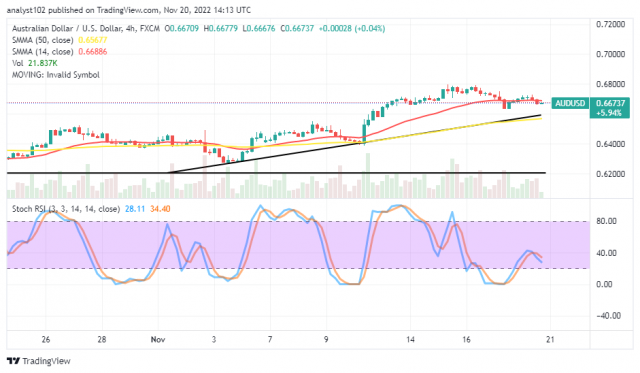
Over time, the AUD/USD medium-term chart reveals that the currency pair has been in a bullish-trending outlook above the trend line of the bigger SMA. The 14-day SMA I indicator is at 0.66886 over the 0.65677 value of the 50-day SMA indicator. Price has been featuring corrections between 0.6800 and 0.6600. The Stochastic Oscillators have crossed their lines southbound from the 40 levels to 34.40 and 28.11 levels. At this point, sellers should be strategic toward getting decent shorting order entries beneath the resistance value line mentioned above.
Note: Forexschoolonline.com is not a financial advisor. Do your research before investing your funds in any financial asset or presented product or event. We are not responsible for your investing results.
Learn to Trade Forex Online
AUD/USD Market Sets for a Depression at 0.6800
Footer

ForexSchoolOnline.com helps individual traders learn how to trade the Forex market
WARNING: The content on this site should not be considered investment advice and we are not authorised to provide investment advice. Nothing on this website is an endorsement or recommendation of a particular trading strategy or investment decision. The information on this website is general in nature so you must consider the information in light of your objectives, financial situation and needs.
Investing is speculative. When investing your capital is at risk. This site is not intended for use in jurisdictions in which the trading or investments described are prohibited and should only be used by such persons and in such ways as are legally permitted. Your investment may not qualify for investor protection in your country or state of residence, so please conduct your own due diligence or obtain advice where necessary. This website is free for you to use but we may receive a commission from the companies we feature on this site.
We Introduce people to the world of currency trading. and provide educational content to help them learn how to become profitable traders. we're also a community of traders that support each other on our daily trading journey
Forexschoolonline.com is not a financial advisor. Do your research before investing your funds in any financial asset or presented product or event. We are not responsible for your investing results.

Leave a Reply