AUD/USD Prediction – December 20
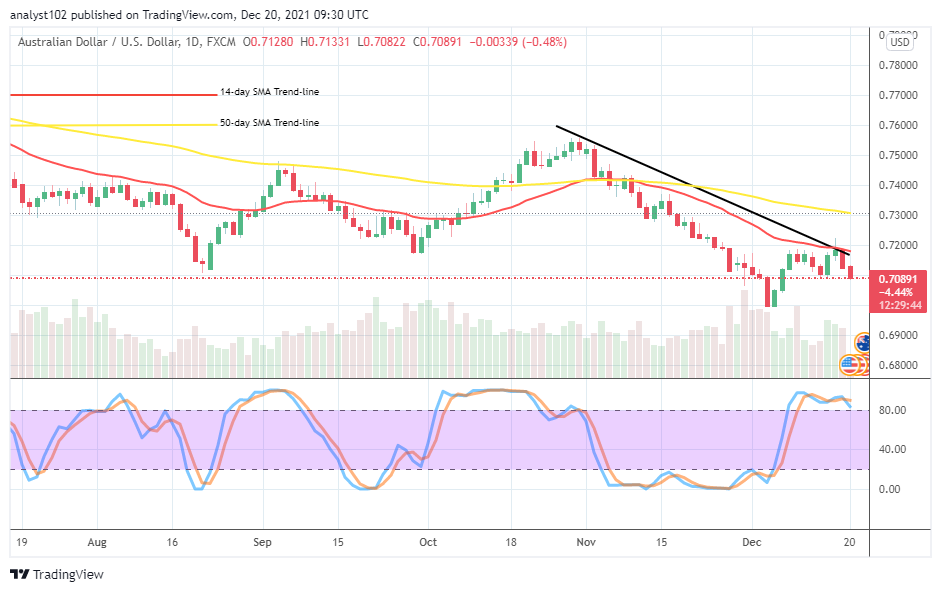
The AUD/USD price has encountered resistance at a higher-lower trading spot, and as a result, the currency pair market reverts to a descending order outlook. Price currently trades around 0.7089 at a smaller negative percentage of 0.48 negative.
AUD/USD Market
Key Levels:
Resistance levels: 0.7200, 0.7300, 0.7400
Support levels: 0.7000, 0.6900, 0.6800
AUD/USD – Daily Chart
The AUD/USD daily chart showcases that the currency pair market reverts to a descending order of a trading outlook after hitting a psychological resistance of around 0.7100. It needed to recall that the market embarked on recovery not too long before experiencing another current retarding-trading situation. The 50-day SMA indicator is above the 14-day SMA indicator. The Stochastic Oscillators are in the overbought region, trying to cross the lines southbound against the range of 80 to suggest a returning of downward pressure is in the loom. Does the present situation worthy of capitalizing sell orders on as the AUD/USD market revert to a descending order?
To some reasonable extent, it is worthy of exerting sell orders as the present trading situation appears, succumbing to a falling pressure as the AUD/USD market reverts to descending order. In addition to that, the outlook suggests that the launching of buying orders should suspend until a while price eventually finds support at a lower trading zone on a long-term downing of the currency pair market operations.
On the downside of the technical analysis, the AUD/USD market short-position takers needed to heighten more forces on the current stage of downsizing far beyond 0.7100. 0.7200 resistance level has to stand for a long time overhead barrier against any attempt to surge higher beyond the value line in the near time. However, the emergence of a bullish returning candlestick around the trend line of the 14-day SMA will potentially lead the market back on a northward journey systemically.
Summarily, as of writing, indicators suggest that traders should continue to lookout for decent sell entries for a while. In the light of intensifying the downward pressure, 0.7000 will breach to let the market re-settle for lower-trading spots. AUD/USD 4-hour Chart
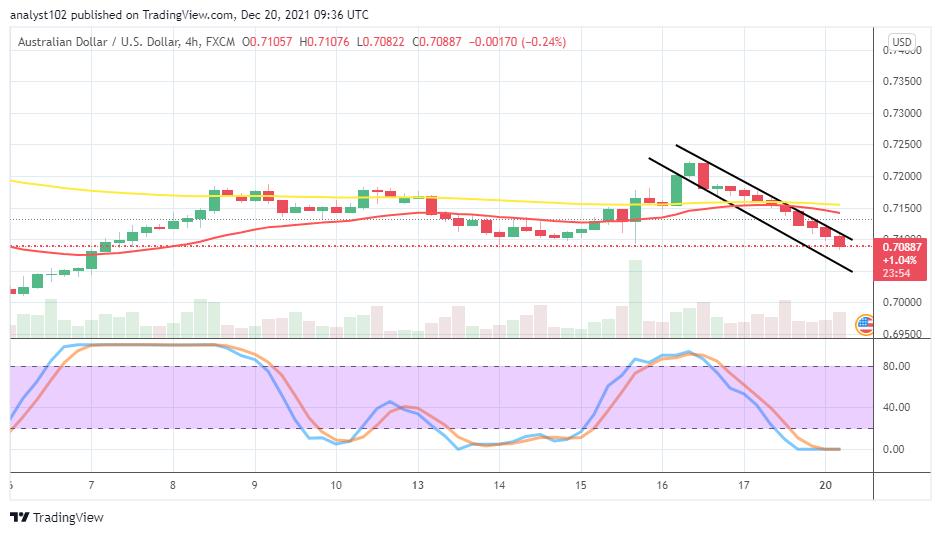
The AUD/USD 4-hour chart shows that the currency pair market trend is in a bearish outlook as a series of bearish candlesticks have formed, breaking the trend lines of the SMAs to the south side. The 14-day SMA trend line is underneath the 50-day SMA trend line. The Stochastic Oscillators are in the oversold region with the lines conjoined tightly, pointing toward the east at the range of zero. That signifies that the currency market may find support soon. But, if the price consolidates more, around 0.7100, it would sound ideal that buying intentions should be put on hold until a while.
Note: Forexschoolonline.com is not a financial advisor. Do your research before investing your funds in any financial asset or presented product or event. We are not responsible for your investing results.


Leave a Reply