AUD/USD Price Prediction – AUGUST 7
The AUD/USD market reverses southward after stretching northward to hit resistance around 0.7000 in recent past operations. Price is about ninety pips gone to the downside from the value line as it features at 0.6910 at a minimal 0.82% negative.
AUD/USD Market
Key Levels:
Resistance levels: 0.7050, 0.7150, 0.7250
Support levels: 0.6850, 0.6750, 0.6650
AUD/USD – Daily Chart
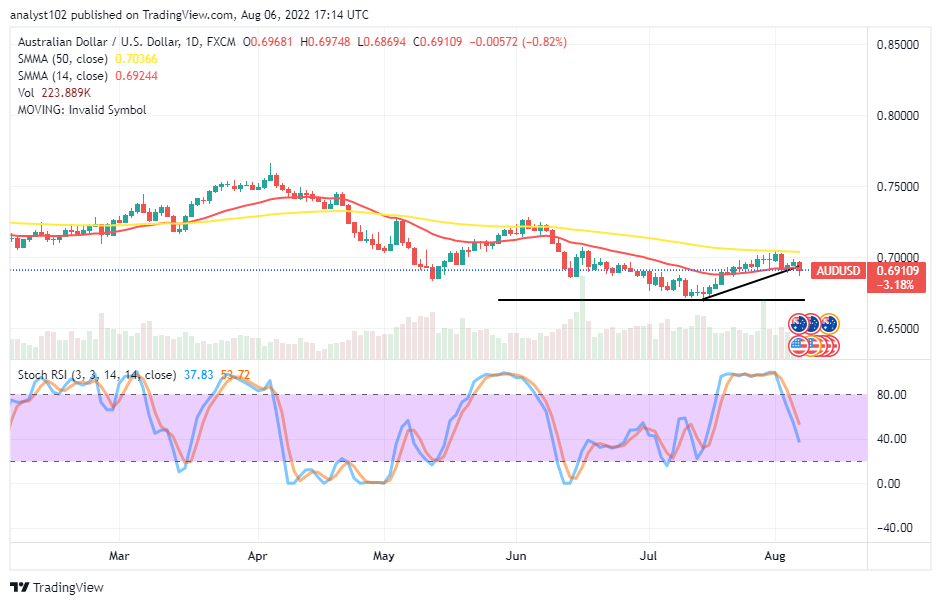
The AUD/USD daily chart reveals the currency pair market reverses southward after it hit resistance around 0.7000. The horizontal remains drawn at the 0.6700 level to markup the point from where the price has sprung in the previous trading activities. The 14-day SMA indicator is around 0.6924 below the value line of the 50-day SMA indicator at 0.7036. The Stochastic Oscillators have crossed southbound from the overbought region, closely touching the range of 40. They are still somewhat pointing to the south side. Will there be a furtherance of correction in the AUD/USD market beyond its current trading level afterward?
The current trading outlook suggests a sell signal has been established around the 0.7000 level for bears to ride on the AUD/USD market for a while. As the currency pair market reverses southward from around the value line, long-position takers should be wary of executing new selling orders.
On the downside of the technical, the AUD/USD market bears have to intensify efforts to ensure the breakdown of the 14-day SMA indicator is possible in its current correctional motion. Should that assumption be, some declining forces will play out to the extent of seeing the market running below 0.6925 in the following operations.
The analytics, at a glance, the overriding verdict in the AUD/USD market operation has some downs that will materialize underneath the 0.7000 resistance level for some time. AUD/USD 4-hour Chart
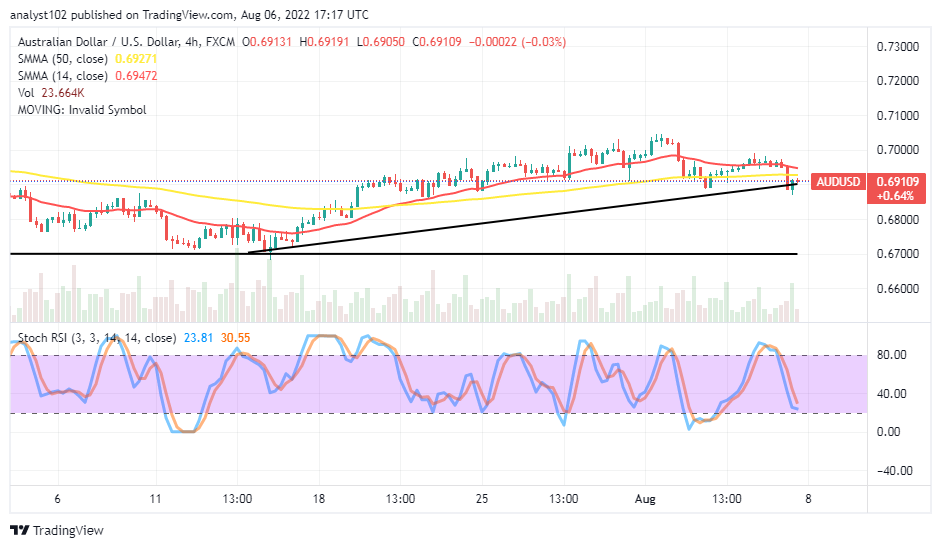
The AUD/USD medium-term chart portrays the currency pair as relatively in a bullish outlook. But, it has appeared the currency pair market reverses southward at 0.7000, having breached past it briefly initially. The Stochastic Oscillators have moved southbound closely to the range of 20. And they are now trying to cross the lines back northbound, indicating the downward force is getting a relaxation. Price may have to move upward again for a test of resistances between 0.6950 and 0.7000 before running back into a downward-trending move afterward.
Note:Forexschoolonline.com is not a financial advisor. Do your research before investing your funds in any financial asset or presented product or event. We are not responsible for your investing results.
Learn to Trade Forex Online
AUD/USD Market Reverses Southward at 0.7000
Footer

ForexSchoolOnline.com helps individual traders learn how to trade the Forex market
WARNING: The content on this site should not be considered investment advice and we are not authorised to provide investment advice. Nothing on this website is an endorsement or recommendation of a particular trading strategy or investment decision. The information on this website is general in nature so you must consider the information in light of your objectives, financial situation and needs.
Investing is speculative. When investing your capital is at risk. This site is not intended for use in jurisdictions in which the trading or investments described are prohibited and should only be used by such persons and in such ways as are legally permitted. Your investment may not qualify for investor protection in your country or state of residence, so please conduct your own due diligence or obtain advice where necessary. This website is free for you to use but we may receive a commission from the companies we feature on this site.
We Introduce people to the world of currency trading. and provide educational content to help them learn how to become profitable traders. we're also a community of traders that support each other on our daily trading journey
Forexschoolonline.com is not a financial advisor. Do your research before investing your funds in any financial asset or presented product or event. We are not responsible for your investing results.

Leave a Reply