AUD/USD Price Prediction – April 4
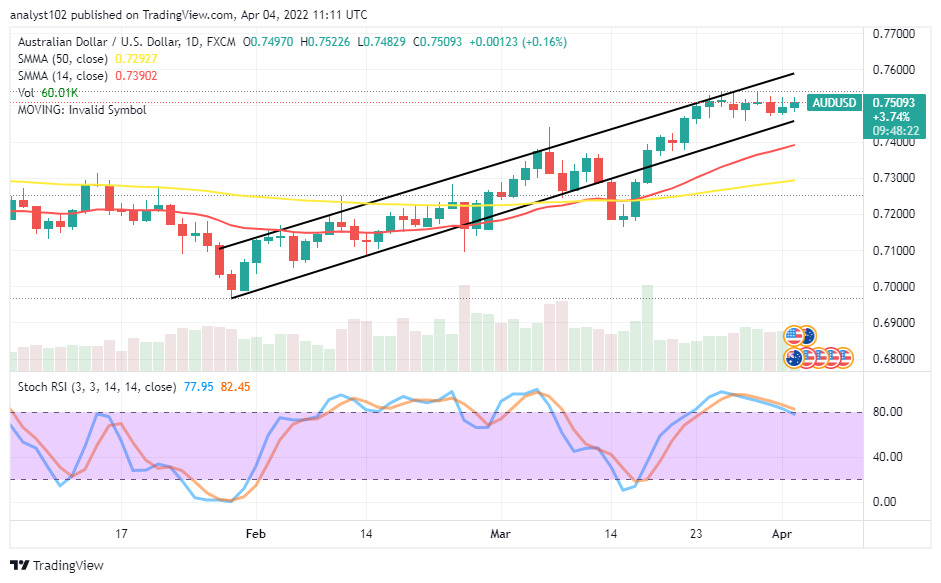
After a chain of higher forces in the AUD/USD trade, the currency market pair currently results in a range motion. The opening price is 0.7497, trading between the high and low of 0.7522 and 0.7482, keeping an average minimal positive percentage rate of 0.16.
AUD/USD Market
Key Levels:
Resistance levels: 0.7600, 0.7700, 0.7800
Support levels: 0.7400, 0.7300, 0.7200
AUD/USD – Daily Chart
The AUD/USD daily chart showcases the currency pair market results in a range motion at the upper resistance trading spot within the bullish channel trend lines drawn. The 14-day SMA indicator is above the 50-day SMA indicator. And they are underneath the SMA trend lines. The Stochastic Oscillators are in the overbought, trying to bend southbound against the range of 80. That signifies that a downward force is imminent. Will the AUD/USD trade push more to the upside as the currency pair market operation results in a range motion?
There is currently a bullish candlestick in the making, signifying that upward pressure is somewhat going on as the AUD/USD market operation results in a range motion. Buying pressures have to intensify in the consolidation moving manner around 0.7500 will let the price approach a high resistance at 0.7600. A pit stop is bound to occur if that presumption eventually plays out.
On the downside of the technical analysis, the AUD/USD market bears are to be on the lookout for price rejection around the resistance trading line below 0.7600A bearish candlestick against the lower bullish trend line to occur before considering a sell order.
The analytics, at a glance, would be that the subsequent formation of the candlestick has to form, favoring either side to confirm the direction around 0.7500. Sellers may have to be on the lookout for decent entry around the 0.7600 resistance line when the market is likely to return for a drawdown. AUD/USD 4-hour Chart
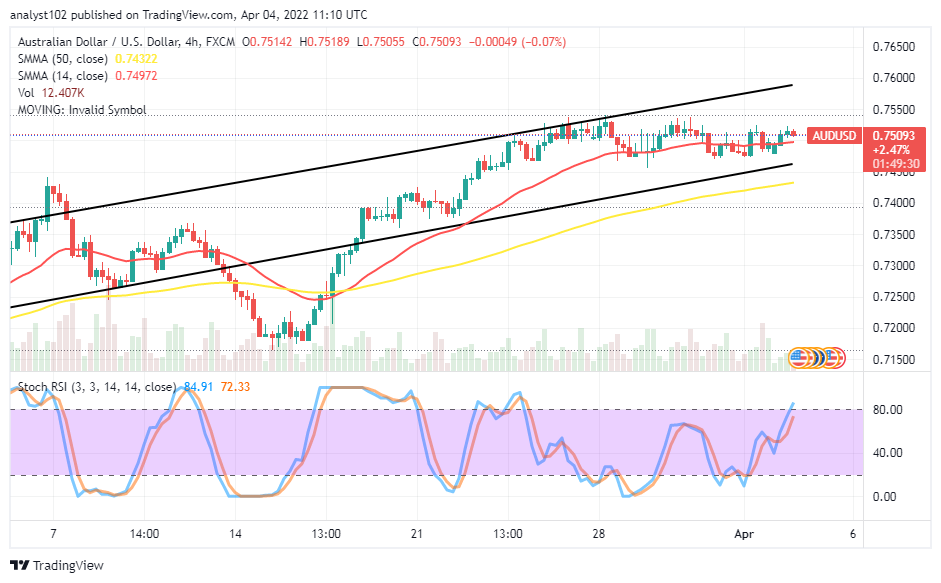
The AUD/USD 4-hour chart showcases the currency pair market results in a range motion. The range motions are featured underneath the higher resistance at 0.7550 in the medium-term run. The 14-day SMA indicator is above the 50-day SMA indicator. The Stochastic Oscillators are attempting to move into the overbought region. Traders would have to wait for active price action to the upside to observe a decent sell entry when the price shows a significant reversal mode from a high level.
Note:Forexschoolonline.com is not a financial advisor. Do your research before investing your funds in any financial asset or presented product or event. We are not responsible for your investing results.
Learn to Trade Forex Online
AUD/USD Market Results in a Range Motion
Footer

ForexSchoolOnline.com helps individual traders learn how to trade the Forex market
WARNING: The content on this site should not be considered investment advice and we are not authorised to provide investment advice. Nothing on this website is an endorsement or recommendation of a particular trading strategy or investment decision. The information on this website is general in nature so you must consider the information in light of your objectives, financial situation and needs.
Investing is speculative. When investing your capital is at risk. This site is not intended for use in jurisdictions in which the trading or investments described are prohibited and should only be used by such persons and in such ways as are legally permitted. Your investment may not qualify for investor protection in your country or state of residence, so please conduct your own due diligence or obtain advice where necessary. This website is free for you to use but we may receive a commission from the companies we feature on this site.
We Introduce people to the world of currency trading. and provide educational content to help them learn how to become profitable traders. we're also a community of traders that support each other on our daily trading journey
Forexschoolonline.com is not a financial advisor. Do your research before investing your funds in any financial asset or presented product or event. We are not responsible for your investing results.

Leave a Reply