AUD/USD Prediction – October 18
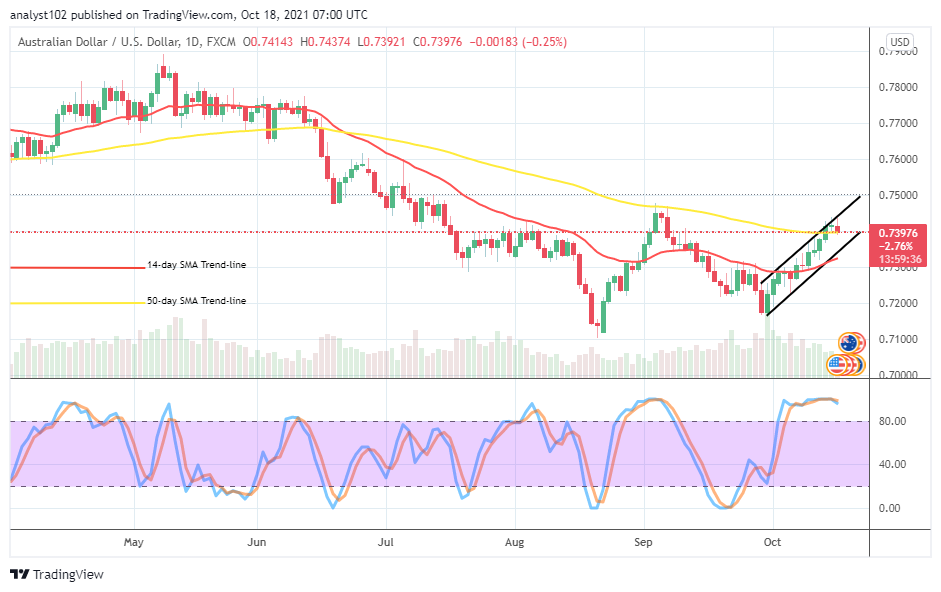
It is currently on the AUD/USD financial book of records that the currency pair market rallying extends to 0.7400 resistance level. The fiat currency pair’s percentage rate is at -0.25 as price trades around 0.7397.
AUD/USD Market
Key Levels:
Resistance levels: 0.7500, 0.7600, 0.7700,
Support levels: 0.7300, 0.7200, 0.7100
AUD/USD – Daily Chart
The AUD/USD daily chart depicts that the currency pair market rallying extends to a higher resistance trading line at 0.7400 since the Oct. 14th trading session until of writing today. The 14-day SMA trend-line is underneath the 50-day SMA trend-line as the bullish channel trend lines drew to align with the rallying path that the market keeps across them. The Stochastic Oscillators are in the overbought region with conjoined lines consolidating in it. And they have, with the conjoined lined lines, briefly point southbound. That could mean that the pair is again warming up to downsize its valuation.
Could there be more sustainable upward pressures as the AUD/USD market rallying extends to a 0.7400 resistance level?
The market line at 0.7400 will serve as the vital trading line to expect the subsequent price reactions to favor more ups or a return motion of downs. A fearful breakout to the north side is needed by bulls at the expense of bears’ further weaknesses at that level to have better-propelled movements to the upside. That assumption may not play out in the near time while there is no volatility.
On the downside of the technical analysis, the AUD/USD market bears now have the points between 0.7400 and 0.7500 to resuscitate their presences in the business operations as they did during the last September 7th session. The former value-line mentioned earlier has to be focused more on determining the probable actual direction of the market. Therefore, a sudden breakdown at the point will likely give a decent sell entry.
Summarily, it appears again that the AUD/USD market operations face a resistance line as it has recently begun rallying motions. Traders to be on the lookout for a spike at 0.7400 devoid of reversal pattern to launch a buy position or a breakdown at the level to consider a short position entry. AUD/USD 4-hour Chart
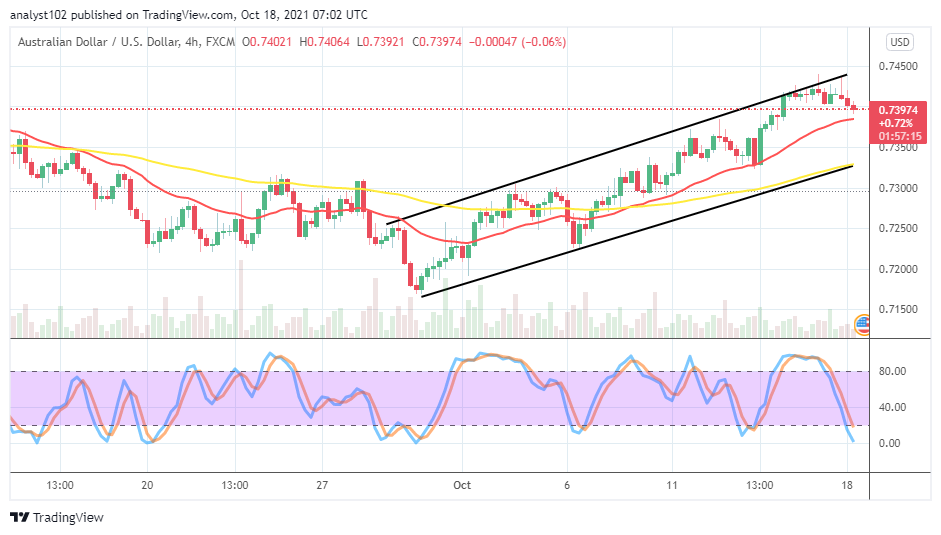
The AUD/USD medium-term chart reveals that the currency pair market pushes in bullish channel trend lines as the price has touched a higher line close to 0.7450 during operations between Oct 15th and the late hour of 17th. The 14-day SMA trend-line is closer underneath 0.7400 level above the 50-day SMA trend-line. The Stochastic Oscillators have slightly moved into the oversold region, attempting to close the lines a bit below the range of 20. That suggests that the currency pair market may regain its momentum after a while that price goes a bit lower to around 0.7350.
Note: Forexschoolonline.com is not a financial advisor. Do your research before investing your funds in any financial asset or presented product or event. We are not responsible for your investing results.
Learn to Trade Forex Online
AUD/USD Market Rallying, Extends to 0.7400 Resistance
Footer

ForexSchoolOnline.com helps individual traders learn how to trade the Forex market
WARNING: The content on this site should not be considered investment advice and we are not authorised to provide investment advice. Nothing on this website is an endorsement or recommendation of a particular trading strategy or investment decision. The information on this website is general in nature so you must consider the information in light of your objectives, financial situation and needs.
Investing is speculative. When investing your capital is at risk. This site is not intended for use in jurisdictions in which the trading or investments described are prohibited and should only be used by such persons and in such ways as are legally permitted. Your investment may not qualify for investor protection in your country or state of residence, so please conduct your own due diligence or obtain advice where necessary. This website is free for you to use but we may receive a commission from the companies we feature on this site.
We Introduce people to the world of currency trading. and provide educational content to help them learn how to become profitable traders. we're also a community of traders that support each other on our daily trading journey
Forexschoolonline.com is not a financial advisor. Do your research before investing your funds in any financial asset or presented product or event. We are not responsible for your investing results.

Leave a Reply