AUD/USD Price Prediction – September 4
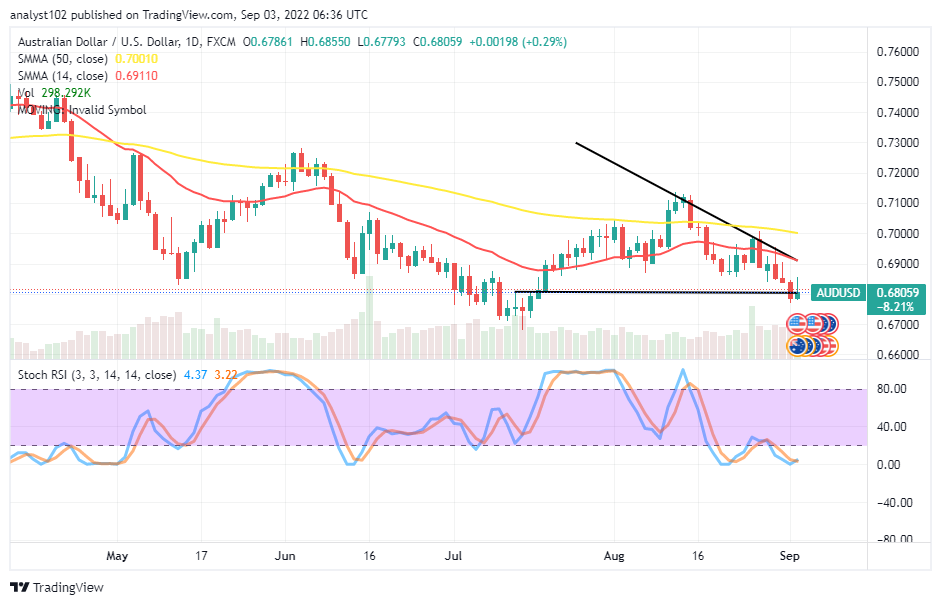
Over time, a line of corrections has occurred in the AUD/USD trade that has led to a situation of seeing the currency pair market push lower to find support. Price is trading around 0.6805 between the low and high of 0.6779 and 0.6855 value lines, keeping a minute percentage rate of 0.29 positive.
AUD/USD Market
Key Levels:
Resistance levels: 0.7000, 0.7100, 0.7200
Support levels: 0.6700, 0.6600, 0.6500
AUD/USD – Daily Chart
The daily chart showcases the currency pair market pushes lower to find support around the 0.6800 level. The 14-day SMA I indicator is at 0.6911 below the 0.7001 value point of the 50-day SMA indicator. The bearish trend line drew southward to back the smaller SMA at its resistance value line. The Stochastic oscillators are at 4.37 and 3.22 range values within the oversold region. Has a reliable bullish signal featured to beacon an end to the AUD/USD market downward trend?
There has been an indication that the AUD/USD market downward trending motion has been on an intense to a notable lower-trading spot as the currency pair tries to find support. A reliable bullish signal has been in the making following the previous technical trading outlook; the price may still push, lowering to around the 0.6700 level before finding a stance to leverage an upward stride afterward.
On the downside of the technical, there can still be some leftover forces that may systemically lead to more lows between the points of 0.6800 and 0.67000 to let the currency pair trade complete its course to the downside, as it happened previously. However, sellers may not have a decent entry to launch orders as there can be a rebound from the lower line.
The analytics, at a glance, there has seemingly been a turnaround condition, suggesting that buyers may soon control the rein of the AUD/USD market. A smaller bullish candlestick has been beefing to signify that. AUD/USD 4-hour Chart
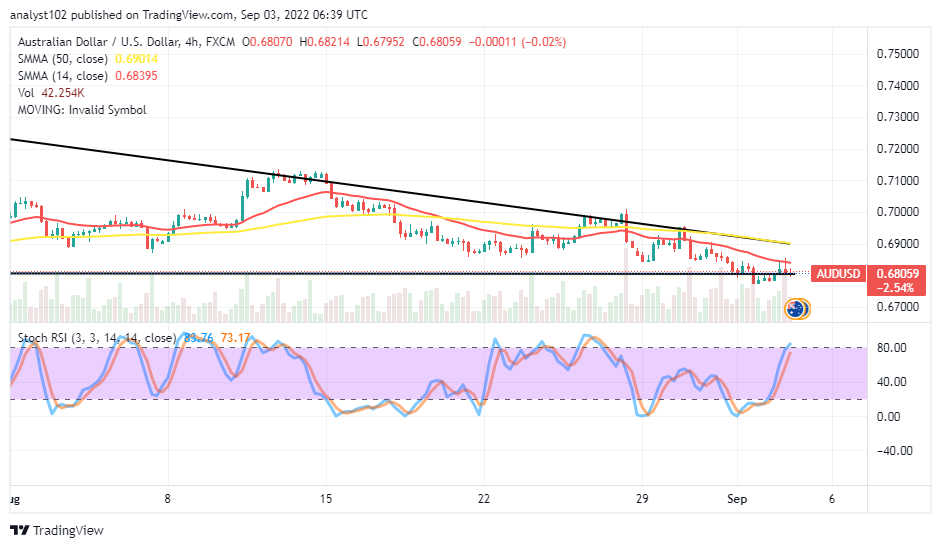
The AUD/USD 4-hour chart reveals the currency pair market pushes lower to find support around the 0.6800 level. In the medium-term running outlook, bears appear not to lose their stances outrightly to the possibility of a bounce-off that can emerge at this moment. The 14-day SMA indicator is at 0.6840, underneath the 0.6901 value line of the 50-day SMA indicator. The Stochastic Oscillators are 73.17 and 83.76 range values.
Note:Forexschoolonline.com is not a financial advisor. Do your research before investing your funds in any financial asset or presented product or event. We are not responsible for your investing results.


Leave a Reply