AUD/USD Prediction – September 6
The AUD/USD market currently makes moves for recovery, slightly out of the long downtrodden pathway the currency pair has been suffering over time. As of writing, the market’s price trades around the level of 0.7433 with about a smaller negative percentage rate of 0.22. That shows that the pressure of recovery has been a bit reduced.
AUD/USD Market
Key Levels:
Resistance levels: 0.7500, 0.7600, 0.7700
Support levels: 0.7300, 0.7200, 0.7100
AUD/USD – Daily Chart
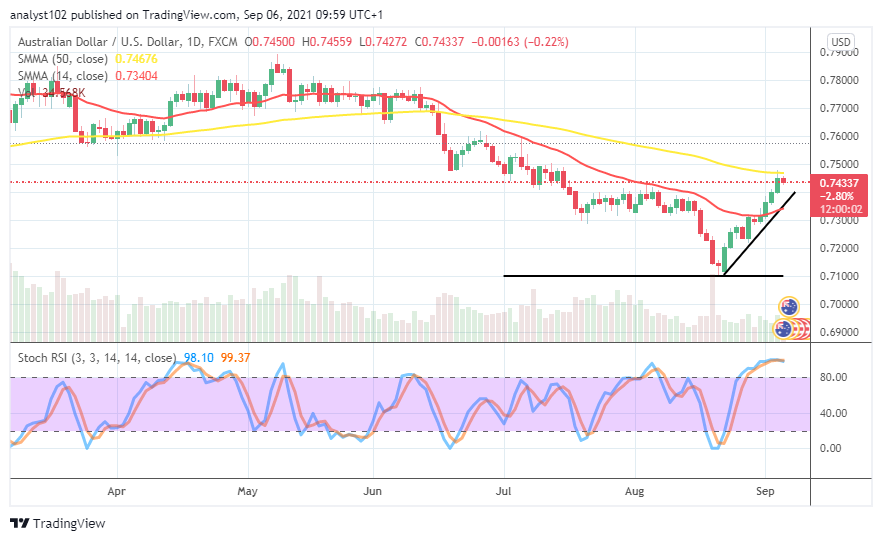
It is on the AUD/USD daily chart; the currency pair market makes moves for recovery, pushing northwardly side above the trend-line of the smaller SMA that is still situated around the path of the recent past upper bearish channel trend-line drew. A bullish candlestick occurred against the upper bearish path-line on September 1st, giving the following days’ sessions a better edge to push further to the upside. The 50-day SMA indicator is above the 14-day SMA indicator. The Stochastic Oscillators are in the overbought region with the lines conjoined, seemingly trying to cross southbound. That probably portends a warning against having further smooth pushes to the north side in the subsequent sessions. Could it be that the AUD/USD pair has finally set for northward pushes as the market makes moves for recovery?
A baseline for support appears to have been found around 0.7100 level while the price was able to spring northwardly from that lower trading zone during the August 23rd trading time. The slight-bending posture of the 14-day SMA indicator beneath the 50-day SMA indicator signifies brighter trading days are in the loom for the AUD/USD market bulls even that there may be a line of smaller downs below 0.7500.
On the downside, the positioning of the bigger SMA trend-line around the level of 0.7500 signifies that the currency pair market will encounter a resistant trading situation in the days’ operations ahead. However, a sustainable sell entry may not as well be coming forth smoothly. A rejection of price movement around the value mentioned will potentially allow bears of the currency pair market to find an entry for a while.
In summary, reliable bearish forces appeared to have been exhausted as the currency pair’s price has managed to push northward off the smaller SMA trend-line, closely reaching a higher line beneath the bigger SMA trend-line. AUD/USD 4-hour Chart
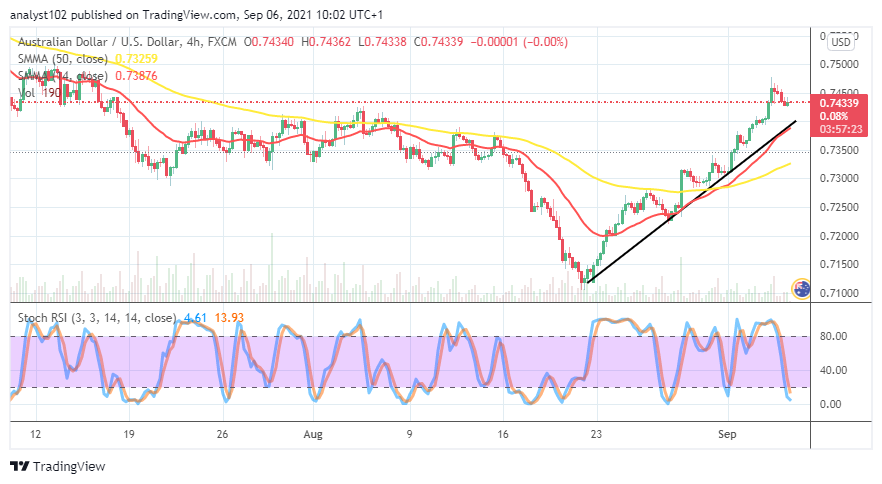
On the AUD/USD 4-hour chart, the currency pair market makes moves for recovery, turning from a bearish trend into a bullish outlook. The 50-day SMA trend-line had intercepted by the 14-day SMA trend-line from the beneath during the August 31st trading period. The bullish trend-line drew tightly above the smaller SMA to place a supportive mark at 0.7400. The Stochastic Oscillators wind down into the oversold region, seemingly making an effort to close the lines. And, that could in no time lead to crossing northbound to suggest a resumption of an uptrend motion of the market.
Note: Forexschoolonline.com is not a financial advisor. Do your research before investing your funds in any financial asset or presented product or event. We are not responsible for your investing results.
Learn to Trade Forex Online
AUD/USD Market Makes Moves for Recovery
Footer

ForexSchoolOnline.com helps individual traders learn how to trade the Forex market
WARNING: The content on this site should not be considered investment advice and we are not authorised to provide investment advice. Nothing on this website is an endorsement or recommendation of a particular trading strategy or investment decision. The information on this website is general in nature so you must consider the information in light of your objectives, financial situation and needs.
Investing is speculative. When investing your capital is at risk. This site is not intended for use in jurisdictions in which the trading or investments described are prohibited and should only be used by such persons and in such ways as are legally permitted. Your investment may not qualify for investor protection in your country or state of residence, so please conduct your own due diligence or obtain advice where necessary. This website is free for you to use but we may receive a commission from the companies we feature on this site.
We Introduce people to the world of currency trading. and provide educational content to help them learn how to become profitable traders. we're also a community of traders that support each other on our daily trading journey
Forexschoolonline.com is not a financial advisor. Do your research before investing your funds in any financial asset or presented product or event. We are not responsible for your investing results.

Leave a Reply