AUD/USD Price Prediction – June 27
There has been a long-holding of the AUD/USD trading operations in a bearish setting as the currency pair market holds positions below 0.7000. Price is trading at a minimal percentage rate of 0.17 negative around 0.6930.
AUD/USD Market
Key Levels:
Resistance levels: 0.7000, 0.7100, 0.7200
Support levels: 0.6800, 0.6700, 0.6600
AUD/USD – Daily Chart
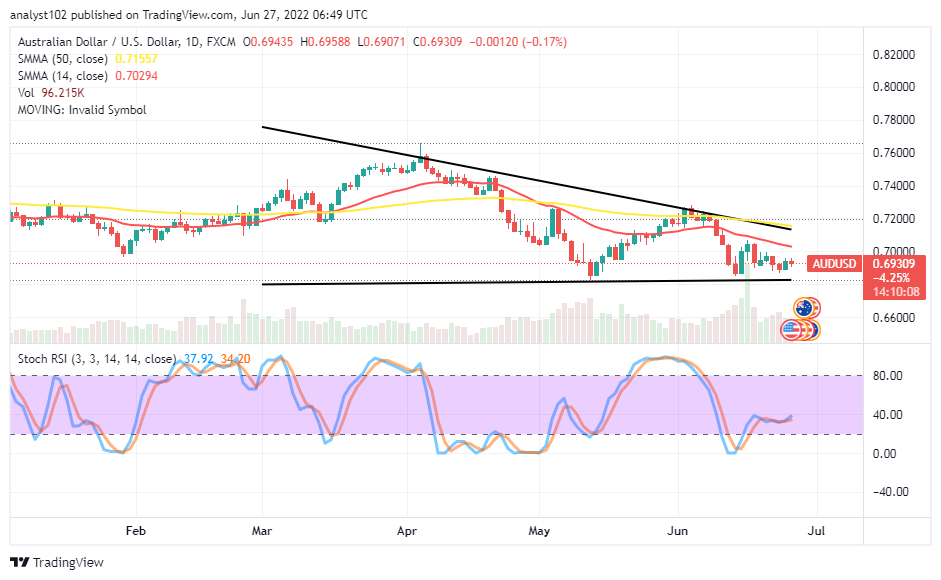
The AUD/USD daily chart showcases the currency pair market holds positions below 0.7000 toward the support baseline at 0.6800. The 14-day SMA indicator is underneath the 50-day SMA indicator. The bearish trend line drew alongside the bigger SMA at the tail end. The Stochastic Oscillators are oscillating closely beneath the 40 range. A smaller Japanese bearish candlestick is in the making to signify that a downward-trending force is ongoing. Which direction will the AUD/USD market is likely to follow next??
The AUD/USD market is under falling pressure as the currency pair price holds positions below the 0.7000 resistance level. A fearful downward reversion beneath the value line may expose the motion toward aiming to revisit a low around the 0.6800 support baseline. Long-position takers may have to get set to re-launch a buying order if the price tends not to drop aggressively afterward at the point.
On the downside of the technical analysis, the AUD/USD market sellers may have their stances firmly consolidating underneath or around the resistances of 0.7029 and 0.7156. A sudden fearful breakout of those points will potentially lead to having higher resistance to focus.
The analytics, at a glance, it seems the AUD/USD market will be pushing for a revisit of a low point around the 0.6800 support baseline before giving in back to an upside direction afterward. AUD/USD 4-hour Chart
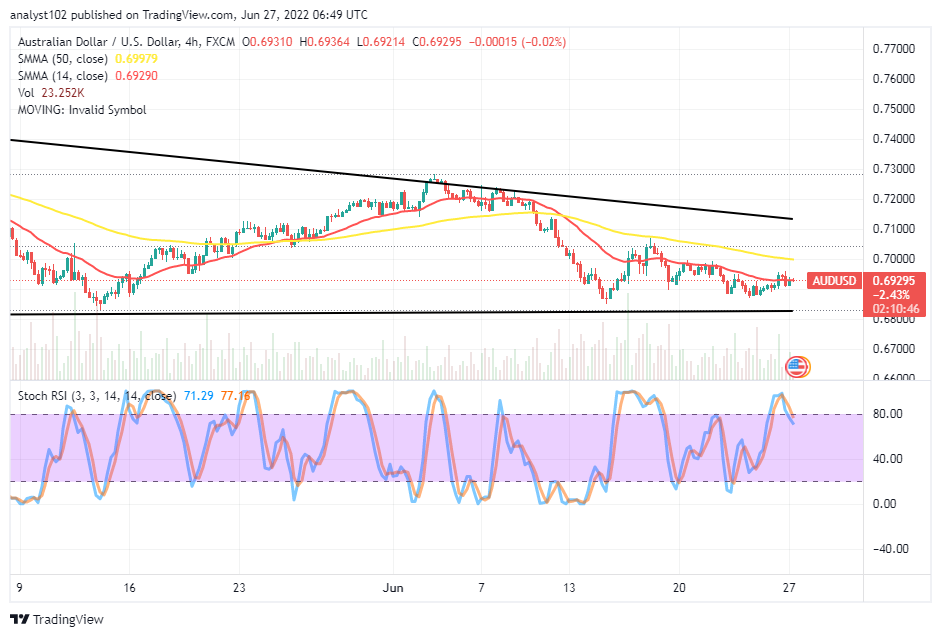
The AUD/USD medium-term chart showcases the currency pair market holds positions below 0.7000. The 14-day SMA indicator is underneath the 50-day SMA indicator. The bigger SMA signifies the real resistance point is 0.6998 approximately. The Stochastic Oscillators have briefly crossed southbound from the overbought region against the 80 range, indicating that a declining force is ongoing. At this point, traders should be wary of trying to trade always at all costs without getting a tangible signal to favor their entry order execution.
Note:Forexschoolonline.com is not a financial advisor. Do your research before investing your funds in any financial asset or presented product or event. We are not responsible for your investing results.
Learn to Trade Forex Online
AUD/USD Market Holds Positions Below 0.7000
Footer

ForexSchoolOnline.com helps individual traders learn how to trade the Forex market
WARNING: The content on this site should not be considered investment advice and we are not authorised to provide investment advice. Nothing on this website is an endorsement or recommendation of a particular trading strategy or investment decision. The information on this website is general in nature so you must consider the information in light of your objectives, financial situation and needs.
Investing is speculative. When investing your capital is at risk. This site is not intended for use in jurisdictions in which the trading or investments described are prohibited and should only be used by such persons and in such ways as are legally permitted. Your investment may not qualify for investor protection in your country or state of residence, so please conduct your own due diligence or obtain advice where necessary. This website is free for you to use but we may receive a commission from the companies we feature on this site.
We Introduce people to the world of currency trading. and provide educational content to help them learn how to become profitable traders. we're also a community of traders that support each other on our daily trading journey
Forexschoolonline.com is not a financial advisor. Do your research before investing your funds in any financial asset or presented product or event. We are not responsible for your investing results.

Leave a Reply