AUD/USD Prediction – September 20
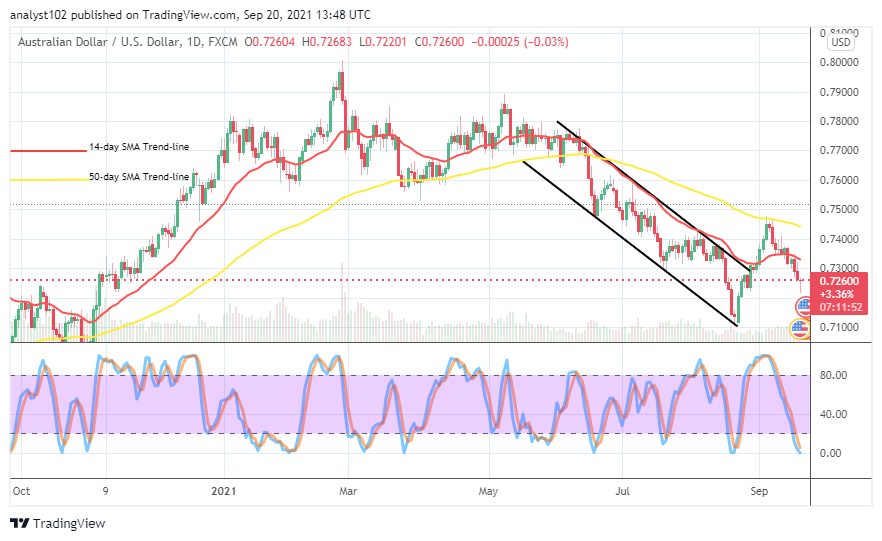
The AUD/USD market heightens retracement while it couldn’t regain much-needed energy to push northward against the 0.7500 resistance level. The currency pair price is trading around 0.7260 at a negative percentage rate of about 0.03. That suggestively depicts that the weight to the downside is on declining.
AUD/USD Market
Key Levels:
Resistance levels: 0.7300, 0.7400, 0.7500
Support levels: 0.7100, 0.7000, 0.6900
AUD/USD – Daily Chart
The AUD/USD daily chart showcases that the currency pair market heightens retracement southward, averaging the support line at 0.7200. The 14-day SMA trend line is underneath the 50-day SMA trend line. Being as it is, the current re-surfacing downward motion breaches the smaller SMA indicator to the south. The Stochastic Oscillators have moved down into the oversold region closer to the range line of zero. That indicates the possibility of that the market finding a sit around 0.7200 in the near time. At what point the AUD/USD trade may find a strong baseline as the market heightens retracement?
Expectantly in about a few days’ trading sessions more, the AUD/USD trade may have found a sit around 0.7200 for a more visible completion of support baseline that bulls needed to re-build their presence. In addition, a bullish candlestick is required for a confirmation to make a decent stride. In the absence of that assumption not coming to play out, the subsequent result may still succumb to the downside on a gradual moving mote.
In an extension of the current downward-moving retracement, the AUD/USD market bears would need to hold their presence firmly beneath the trend line of the smaller SMA. Price may, in the process of consolidating, below the indicator eventually, moves southward further to retest a lower line close above the support line at 0.7100.
In summary, despite that the AUD/USD market faces early retracement motions, long-position traders may still have to wait for a bullish confirmation candlestick to form at a lower trading axis that is capable of engulfing some of the past bearish candlesticks especially, beneath the trend line of the 14-day SMA to be able to re-launch a decent buy order.  AUD/USD 4-hour Chart
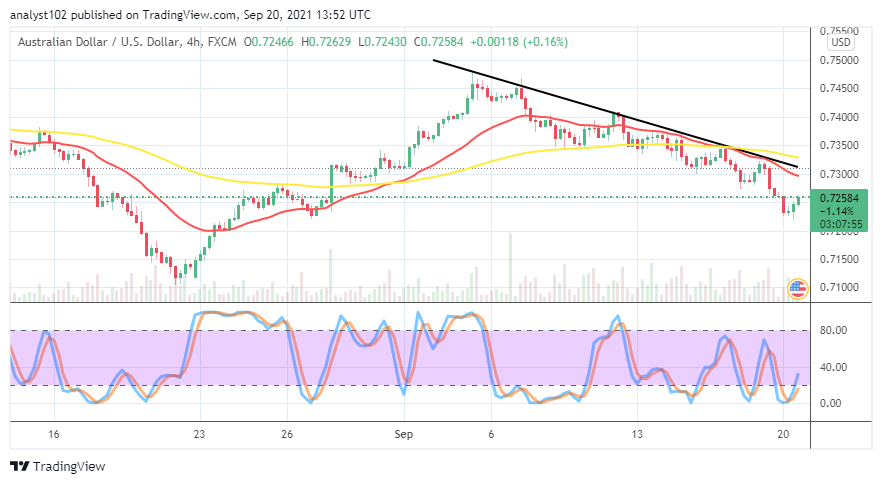
The AUD/USD medium-term showcases that the currency pair market heightens retracement movements far beneath the SMA trend lines. The current trading situation on the 4-hour chart also reveals a close returning of bearish trend as the 14-day SMA is underneath the 50-day SMA. The Stochastic Oscillators have crossed the lines northbound against the range of 20, nearing range 40. That gives a sign that soon afterward, there will be an upswing motion in the fiat currency market.
Note: Forexschoolonline.com is not a financial advisor. Do your research before investing your funds in any financial asset or presented product or event. We are not responsible for your investing results.
Learn to Trade Forex Online
AUD/USD Market Heightens Retracement
Footer

ForexSchoolOnline.com helps individual traders learn how to trade the Forex market
WARNING: The content on this site should not be considered investment advice and we are not authorised to provide investment advice. Nothing on this website is an endorsement or recommendation of a particular trading strategy or investment decision. The information on this website is general in nature so you must consider the information in light of your objectives, financial situation and needs.
Investing is speculative. When investing your capital is at risk. This site is not intended for use in jurisdictions in which the trading or investments described are prohibited and should only be used by such persons and in such ways as are legally permitted. Your investment may not qualify for investor protection in your country or state of residence, so please conduct your own due diligence or obtain advice where necessary. This website is free for you to use but we may receive a commission from the companies we feature on this site.
We Introduce people to the world of currency trading. and provide educational content to help them learn how to become profitable traders. we're also a community of traders that support each other on our daily trading journey
Forexschoolonline.com is not a financial advisor. Do your research before investing your funds in any financial asset or presented product or event. We are not responsible for your investing results.

Leave a Reply