AUD/USD Price Prediction – February 28
It established that the AUD/USD market gets a fresh resistance at 0.7250 while the currency pair lacks the momentum to sustainably stay above some of its last higher levels at closer points. The opening balance of the market is about 0.7158, trading between 0.7193 and 0.7157 at a minute positive percentage rate of about 0.70.
AUD/USD Market
Key Levels:
Resistance levels: 0.7250, 0.7350, 0.7450
Support levels: 0.7100, 0.7000, 0.6900
AUD/USD – Daily Chart
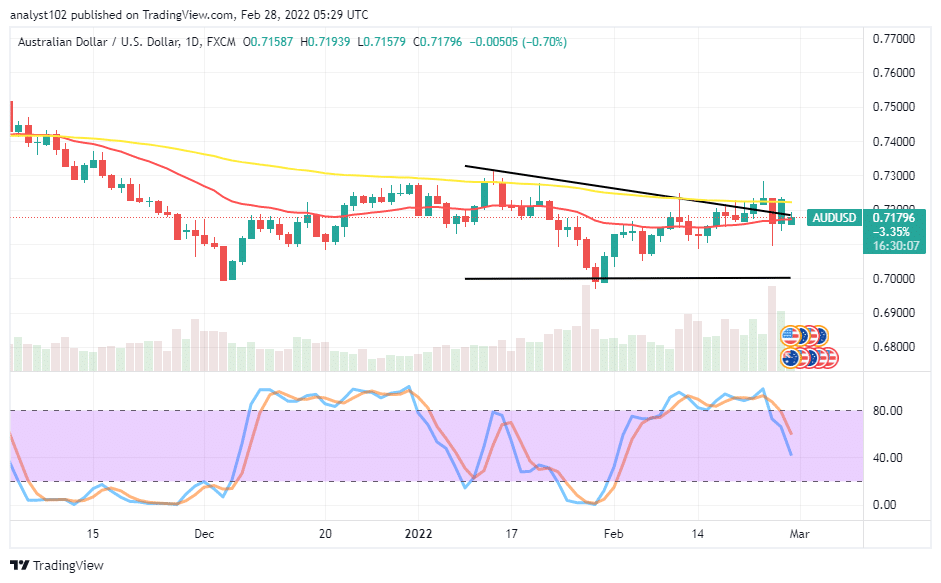
The AUD/USD daily chart showcases the currency pair market gets a fresh resistance at 0.7250 as there has been a slight falling force, believing to generate a massive bearish outcome in the near time. That will be so based on the fact that some indicators suggest reading to the south side. The 14-day SMA is underneath the 50-day SMA. The Stochastic Oscillators have crossed their lines southbound from the overbought region, almost reaching the range of 40. That signifies that a declining force is imminent. Will there be more downs in the AUD/USD trade subsequent trading sessions as the currency pair market gets a fresh resistance at 0.7250?
There has been an occurrence of upward momentum at variant closer points above 0.7250. But, the situation doesn’t portend a sustainable outlook for the AUD/USD price as the market gets a fresh resistance around the value-line mentioned earlier. As a result of that assumption, it would be technically ideal that long-position placers suspend taking an order for a while.
On the downside of the technical analysis, it would be technically ideal that the AUD/USD market short-position placers back up their entries with a price action emerging against seeing a move to the upside at a higher trading spot. The launching of sell orders shouldn’t be in multiples to not overburden the trading capital to avoid letting the market run into a margin call situation afterward.
At a glance, all seem to get again for the selling orders dominance in the AUD/USD market operations as the price has a fresh resistance at 0.7250 trading arena. Therefore, traders are to look out for decent shorting positions. AUD/USD 4-hour Chart
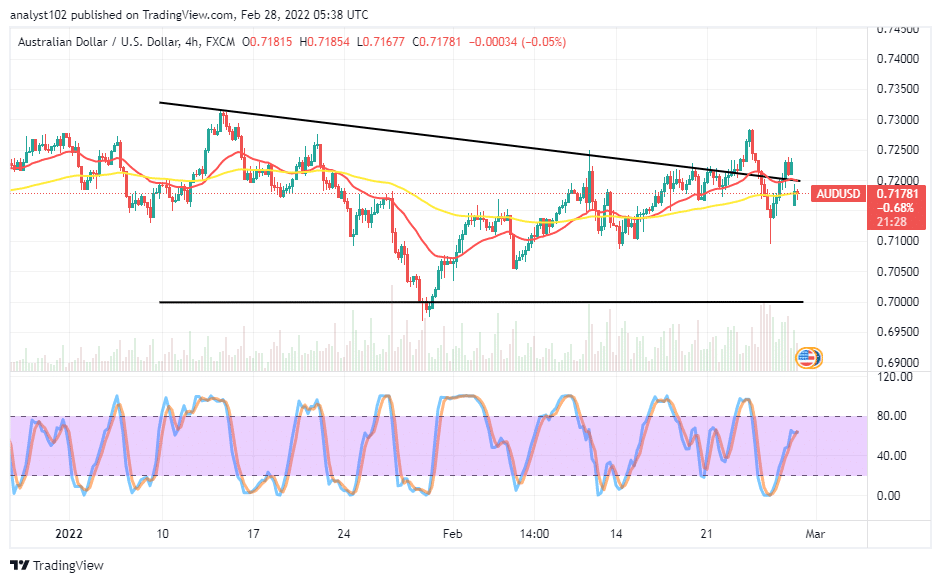
The AUD/USD medium-term chart shows the currency pair market gets a fresh resistance at 0.7250 after springing from a lower. The upper bearish drawn has joined the 14-day SMA indicator at the east end above the 50-day SMA indicator. The horizontal line drawn at 0.7000 level showcases a critical support baseline of the currency pair business operations. The Stochastic Oscillators are attempting to close their lines a bit underneath the range of 80. That indicates some descending orders may still feature beneath the value-line firstly mentioned at the beginning of this analytics write-up.
Note: Forexschoolonline.com is not a financial advisor. Do your research before investing your funds in any financial asset or presented product or event. We are not responsible for your investing results.
Learn to Trade Forex Online
AUD/USD Market Gets a Fresh Resistance at 0.7250
Footer

ForexSchoolOnline.com helps individual traders learn how to trade the Forex market
WARNING: The content on this site should not be considered investment advice and we are not authorised to provide investment advice. Nothing on this website is an endorsement or recommendation of a particular trading strategy or investment decision. The information on this website is general in nature so you must consider the information in light of your objectives, financial situation and needs.
Investing is speculative. When investing your capital is at risk. This site is not intended for use in jurisdictions in which the trading or investments described are prohibited and should only be used by such persons and in such ways as are legally permitted. Your investment may not qualify for investor protection in your country or state of residence, so please conduct your own due diligence or obtain advice where necessary. This website is free for you to use but we may receive a commission from the companies we feature on this site.
We Introduce people to the world of currency trading. and provide educational content to help them learn how to become profitable traders. we're also a community of traders that support each other on our daily trading journey
Forexschoolonline.com is not a financial advisor. Do your research before investing your funds in any financial asset or presented product or event. We are not responsible for your investing results.

Leave a Reply