AUD/USD Prediction – June 14
There has appeared to be a continued range-bound trading outlook in the market operations of AUD/USD. The currency pair now trades around the value of 0.7698 at a percentage reduction rate of about -0.05 as of writing.
AUD/USD Market
Key Levels:
Resistance levels: 0.7800, 0.7900, 0.8000
Support levels: 0.7700, 0.7600, 0.7500
AUD/USD – Daily Chart
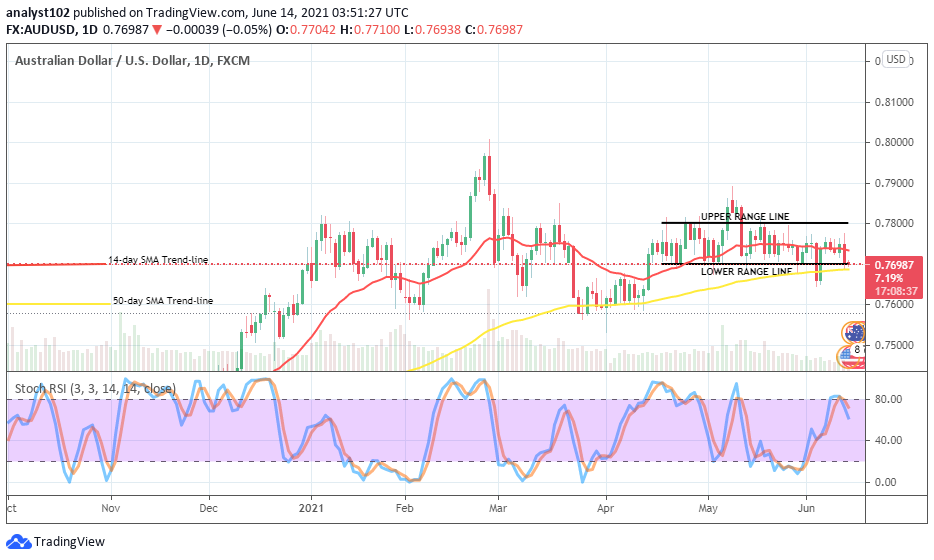
It is now depicted on the AUD/USD daily chart that the currency pair’s worth now tightly trades around the lower range of 0.7700 level. In the recent past, the pair was seen maintaining a kind of mid-trading outlook in the range-bound zones. But, yesterday’s session saw a visible drawdown to the lower range line. The 50-day SMA indicator points toward the east as the 14-day SMA trend-line bends very light down above to yet also point more to the east direction than the south. The Stochastic Oscillators have the lines against range 80 slightly to the southbound in portending that the market is somewhat on a downward move. Will there still be prolonged range-bound trading in the AUD/USD currency pair?
There has been yet no strong indication to suggest that very soon the AUD/USD market will soon end the range-bound trading style that it has embarked upon over a couple of several weeks’ sessions. In the light of that, the lower range-line could be the zone where buyers may have to consider launching a long position mostly while a price rebounding move is spotted.
Price action is much needed to take place against the lower range-line of the currency pair to be able to have a strong belief of a downward market trend taking the full control away from the long-featuring range-bound trading outlook. In the meantime, it is established that the range trading mid-point of 0.7800 and 0.7700 has to be decent sell entry by traders intending to go short.
In summary, traders are most especially enjoined to abide by the range-bound principles of trading technique that states that the lower range-line needed to be the area of buy entry and, the upper range-line could most of the time be the sell entry zone. AUD/USD 4-hour Chart
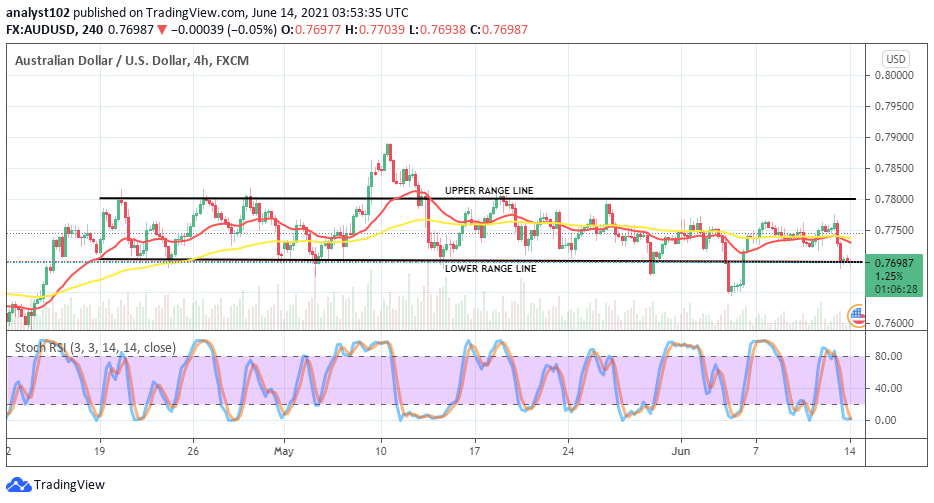
The AUD/USD medium-term chart depicts a downward move that has featured breaching the SMA trend lines to the south. Like wisely, on the daily chart as the range-bound trading outlook is depicted, the 4-hour chart showcases 0.7750 as the main mid-point of the long-ranging moves being embarked upon by the currency pair. The 50-day SMA and the 14-day SMA have conjoined with the smaller indicator slightly pointing to the south tightly below the bigger. The stochastic Oscillators are in the oversold region to suggest the possibility of seeing the downside fading off soon. Therefore, traders intending long may have to be on the alert.
Note: Forexschoolonline.com is not a financial advisor. Do your research before investing your funds in any financial asset or presented product or event. We are not responsible for your investing results.
Learn to Trade Forex Online
AUD/USD Market Features at Lower Range-zone
Footer

ForexSchoolOnline.com helps individual traders learn how to trade the Forex market
WARNING: The content on this site should not be considered investment advice and we are not authorised to provide investment advice. Nothing on this website is an endorsement or recommendation of a particular trading strategy or investment decision. The information on this website is general in nature so you must consider the information in light of your objectives, financial situation and needs.
Investing is speculative. When investing your capital is at risk. This site is not intended for use in jurisdictions in which the trading or investments described are prohibited and should only be used by such persons and in such ways as are legally permitted. Your investment may not qualify for investor protection in your country or state of residence, so please conduct your own due diligence or obtain advice where necessary. This website is free for you to use but we may receive a commission from the companies we feature on this site.
We Introduce people to the world of currency trading. and provide educational content to help them learn how to become profitable traders. we're also a community of traders that support each other on our daily trading journey
Forexschoolonline.com is not a financial advisor. Do your research before investing your funds in any financial asset or presented product or event. We are not responsible for your investing results.

Leave a Reply