AUD/USD Prediction – December 6
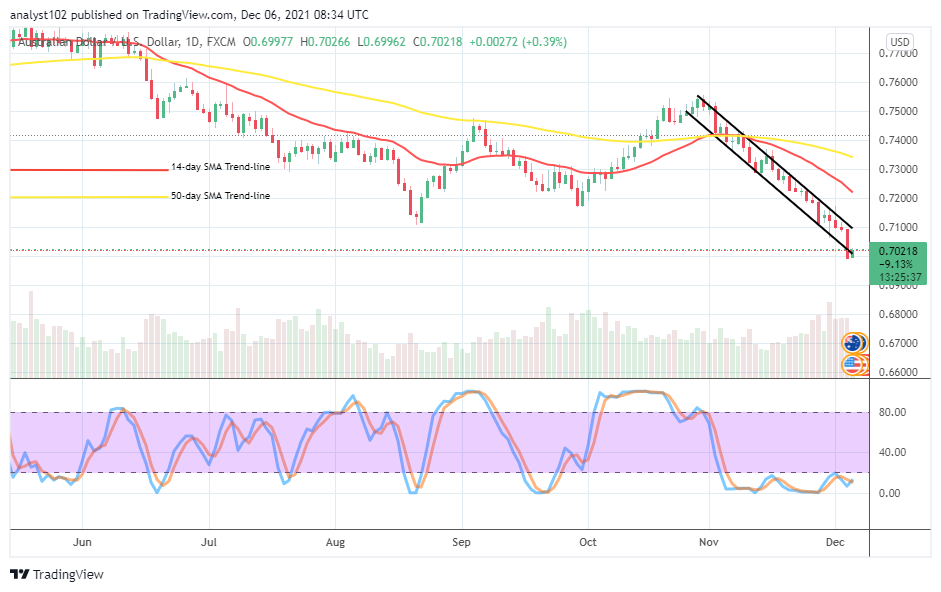
The AUD/USD financial book of records has it that the fiat currency market elongates bearish motions, currently trying to find support around 0.7000. The trade operations keep a minute positive percentage rate of about 0.39 as it possesses an estimated value of around 0.7021 as of writing.
AUD/USD Market
Key Levels:
Resistance levels: 0.7100, 0.7200, 0.7300
Support levels: 0.6900, 0.6800, 0.6700
AUD/USD – Daily Chart
The AUD/USD daily chart showcases that the currency pair market elongates bearish motions as 0.7100 critical support level breached southward eventually. The 14-day SMA indicator is underneath the 50-day SMA indicator. And they are far above the trading zones of the market. That gives rise to keeping the bearish channel trend lines intact, embodying the trading paths to the south direction under the indicators. The Stochastic Oscillators are in the oversold region, moving in a consolidation style to affirm the downward trending outlook. When will there be a strong rebounding signal in the AUD/USD price as the market elongates bearish motions beyond 0.7100?
At this point, it would be necessary that the AUD/USD long-position takers allow about two bullish candlesticks to emerge from a lower trading spot to attest as a strong indication that the currency pair market returns to gathering catalysts before exerting a buy order. The longing of trading positions may as well not have had solid grand to safe execution as the price seems yet to locate an ideal situation for that.
On the downside, the bearish path still appears consolidating its stances in the AUD/USD market operations. However, an indicator has portended an oversold trading condition presently to suggest that the currency pair price may in no time attempt, re-surging for momentums to the upside. Therefore, short-position takers needed to be cautious of exerting more positions, especially while a signal denoting a rebound from a lower trading level comes up.
Summarily, it established that the AUD/USD market trades in a depth zone that belief to be oversold as an upsurge is highly expected in no time to signal an end to the current bearish trending condition. 0.7000 now appears to be the area where that scenario can occur in the subsequent sessions while bulls might have been ready to regain their lost momentums so far. AUD/USD 4-hour Chart
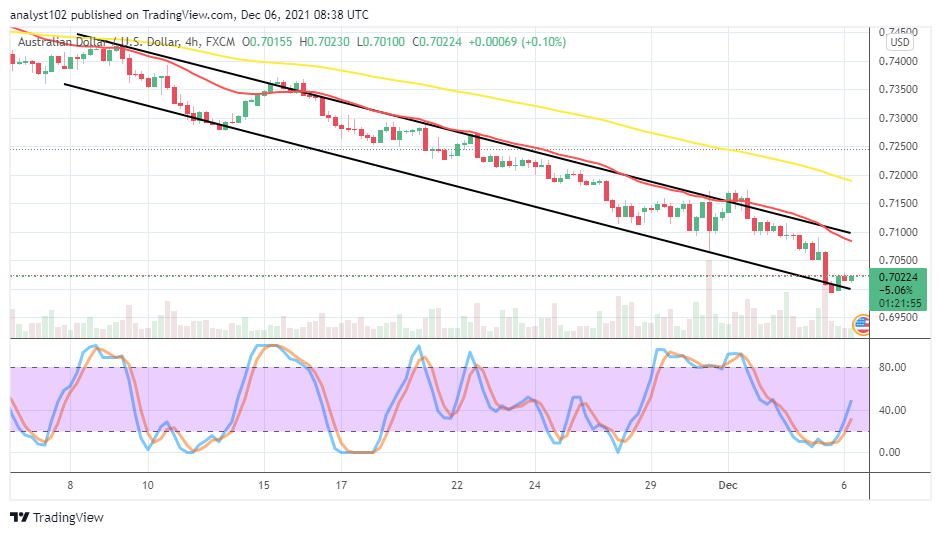
The AUD/USD medium-term chart reveals a long-kept of downward trend as the currency pair market elongates bearish motions in the channels. The upper bearish channel trend line drew alongside the 14-day SMA indicator beneath the 50-day SMA indicator. The Stochastic Oscillators have crossed the lines northbound from the oversold region slightly against the range of 40. The market seems to be building up some energy around 0.7000 level to surge high in the following trading activities.
Note: Forexschoolonline.com is not a financial advisor. Do your research before investing your funds in any financial asset or presented product or event. We are not responsible for your investing results.
Learn to Trade Forex Online
AUD/USD Market Elongates Bearish Motions
Footer

ForexSchoolOnline.com helps individual traders learn how to trade the Forex market
WARNING: The content on this site should not be considered investment advice and we are not authorised to provide investment advice. Nothing on this website is an endorsement or recommendation of a particular trading strategy or investment decision. The information on this website is general in nature so you must consider the information in light of your objectives, financial situation and needs.
Investing is speculative. When investing your capital is at risk. This site is not intended for use in jurisdictions in which the trading or investments described are prohibited and should only be used by such persons and in such ways as are legally permitted. Your investment may not qualify for investor protection in your country or state of residence, so please conduct your own due diligence or obtain advice where necessary. This website is free for you to use but we may receive a commission from the companies we feature on this site.
We Introduce people to the world of currency trading. and provide educational content to help them learn how to become profitable traders. we're also a community of traders that support each other on our daily trading journey
Forexschoolonline.com is not a financial advisor. Do your research before investing your funds in any financial asset or presented product or event. We are not responsible for your investing results.

Leave a Reply