AUD/USD Price Prediction – September 25
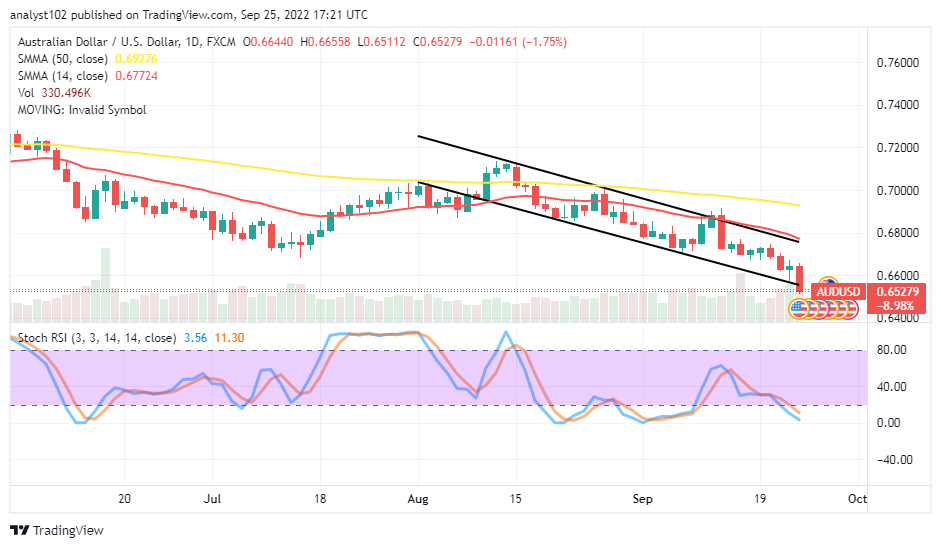
The presence of bears’ efforts has been impactful in the AUD/USD trade activities as the currency pair market draws southward toward the 0.6500 support line. Price’s trading worth bargains within the high and the low-value lines of 0.66558 and 0.65112 at an average negative percentage rate of 1.75.
AUD/USD Market
Key Levels:
Resistance levels: 0.6600, 0.6700, 0.6800
Support levels: 0.6500, 0.6400, 0.6300
AUD/USD – Daily Chart
The SUD/USD daily chart showcases the pairing fiat coin draws southward toward the 0.6500 support level in an aggressively moving manner that caused the market to lose fatly over a hundred pips from its initial 0.6700 lower level of trading. Over time, the positioning of the trading tools indicates the market is under selling pressure as the 140day SMA indicator is at 0.67724, underneath the 0.69276 value point of the 60-day SMA indicator. The Stochastic Oscillators have dipped into the oversold region, maintaining the range values of 11.30 and 3.56. Has a significant change occurred in the current bearish AUD/USD market force?
As of the time of writing, there has been no significant change or signal suggesting the AUD/USD market bears are on the verge of shifting positions as the currency pair price draws southward toward the 0.6500 support line. Buyers are alert to open a buying order if the market only tends to test that value line for a rebound before considering a longing order afterward.
On the downside of the technical, the AUD/USD market sellers may ride alongside the selling wall of a bearish candlestick spanning downward through the point level of 0.6600. But, any attempt by the market to rally or pull back up against the value line may lead to a threat of seeing a steady free fall-off process.
The analytics, at a glance, as it is apparent that bears have been taking a lead in the AUD/USD market operations over time, traders should be wary of any sudden rebound from a dip-trading spot. AUD/USD 4-hour Chart
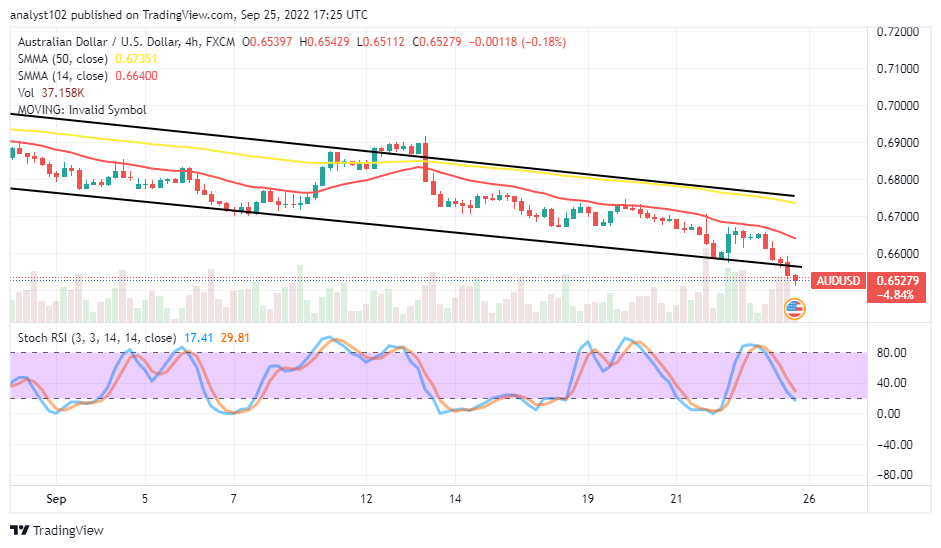
The AUD/USD medium-term chart reveals the currency pair market draws southward toward the 0.6500 support level below the lower bearish trend line. The 14-day SMA indicator is at 0.66400 underneath the 0.67351 value line of the 50-day SMA indicator. The Stochastic Oscillators have crossed southbound from around the 80 range to the positions of 29.81 and 17.41 range values, denoting the gravitational forces to the south direction have gradually been exhausted. Therefore, sellers need to be cautious of exerting further orders at this point.
Note:Forexschoolonline.com is not a financial advisor. Do your research before investing your funds in any financial asset or presented product or event. We are not responsible for your investing results.
Learn to Trade Forex Online
AUD/USD Market Draws Southward Toward 0.6500
Footer

ForexSchoolOnline.com helps individual traders learn how to trade the Forex market
WARNING: The content on this site should not be considered investment advice and we are not authorised to provide investment advice. Nothing on this website is an endorsement or recommendation of a particular trading strategy or investment decision. The information on this website is general in nature so you must consider the information in light of your objectives, financial situation and needs.
Investing is speculative. When investing your capital is at risk. This site is not intended for use in jurisdictions in which the trading or investments described are prohibited and should only be used by such persons and in such ways as are legally permitted. Your investment may not qualify for investor protection in your country or state of residence, so please conduct your own due diligence or obtain advice where necessary. This website is free for you to use but we may receive a commission from the companies we feature on this site.
We Introduce people to the world of currency trading. and provide educational content to help them learn how to become profitable traders. we're also a community of traders that support each other on our daily trading journey
Forexschoolonline.com is not a financial advisor. Do your research before investing your funds in any financial asset or presented product or event. We are not responsible for your investing results.

Leave a Reply