AUD/USD Prediction – January 3
The AUD/USD market activity continues trading in channels at a percentage rate of about 0.34 negative. Presently, the currency pair price is trading between 0.7277 and 0.7239 levels, respectively.
AUD/USD Market
Key Levels:
Resistance levels: 0.7300, 0.7400, 0.7500
Support levels: 0.7100, 0.7000, 0.6900
AUD/USD – Daily Chart
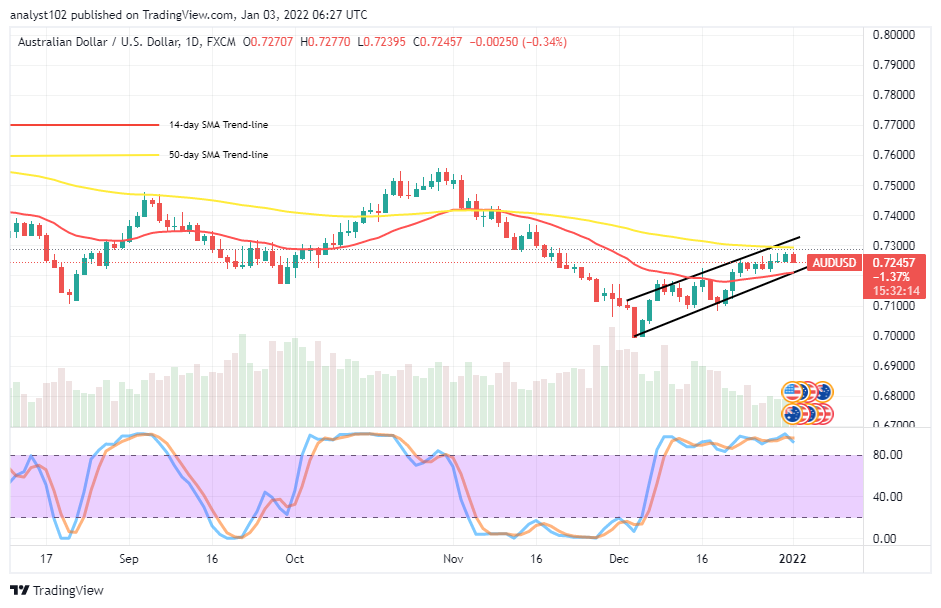
The AUD/USD daily chart reveals the currency pair market continues trading in channels. The 50-day SMA indicator is at the 0.7300 resistance level above the 14-day SMA indicator is at the 0.7200 support level. Over a couple of sessions, variant candlesticks have formed in those value lines to indicate that price has resulted in featuring severally within. The Stochastic Oscillators are in the overbought region, moving in a grand style of a consolidation-moving manner. The indicator slightly points toward the south direction within. Will the AUD/USD price succumb to higher pressures under the 0.7300 resistance as the currency pair market continues trading in channels?
It appears that the AUD/USD price valuation will succumb to intensive higher falling pressures under the 0.7300 resistance level as the market continues trading in channels. While that assumption materializes, 0.7200 and 0.7100 are the levels where the market will have to re-shape to get other rounds of decent upswings.
On the downside of the technical analysis, the AUD/USD market has to firmly get resisted around 0.7300 with a bearish candlestick forming to engulf some of the penultimate candlesticks already formed above the 0.7200 before a sell order could decently launch. Even as the current situation’s readings suggest an overbought condition for the currency pair trading activities, short-position takers needed to exercise more patience to get a decent sell signal.
Summarily, it now appears the AUD/USD market operation has reached an overbought trading condition, suggesting a return of sell-offs in no time. Therefore, riding further on a sudden spike around the 0.7300 may lead to getting bulls trapped in no time. AUD/USD 4-hour Chart
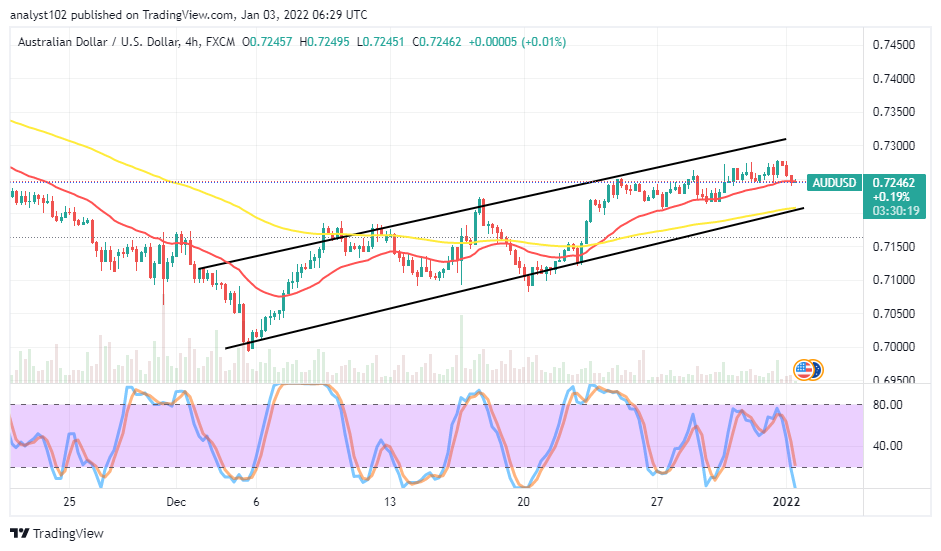
The AUD/USD medium-term chart shows that the AUD/USD market continues trading in channels. Price has briefly reversed southward against the trend line of the 14-day SMA around 0.7250. The 50-day SMA indicator is underneath the 14-day SMA indicator. The bullish channels drew to embody the SMAs. The Stochastic Oscillators are in the oversold region, pointing slightly to the southbound within to indicate that a falling force is prevailing somewhat presently. It still appears on this chart that trading zones between 0.7250 and 0.7300 are the ideal resistances around which decent sell orders may exert.
Note: Forexschoolonline.com is not a financial advisor. Do your research before investing your funds in any financial asset or presented product or event. We are not responsible for your investing results.


Leave a Reply