AUD/USD Prediction – May 10
The AUD/USD trade valuation has seen a significant breakout of the 0.7800 recent resistance trading zone to achieve a higher profit. Price sees a 0.51% increase as at writing.
AUD/USD Market
Key Levels:
Resistance levels: 0.8000, 0.8100, 0.8200
Support levels: 0.7700, 0.7600, 0.7500
AUD/USD – Daily Chart
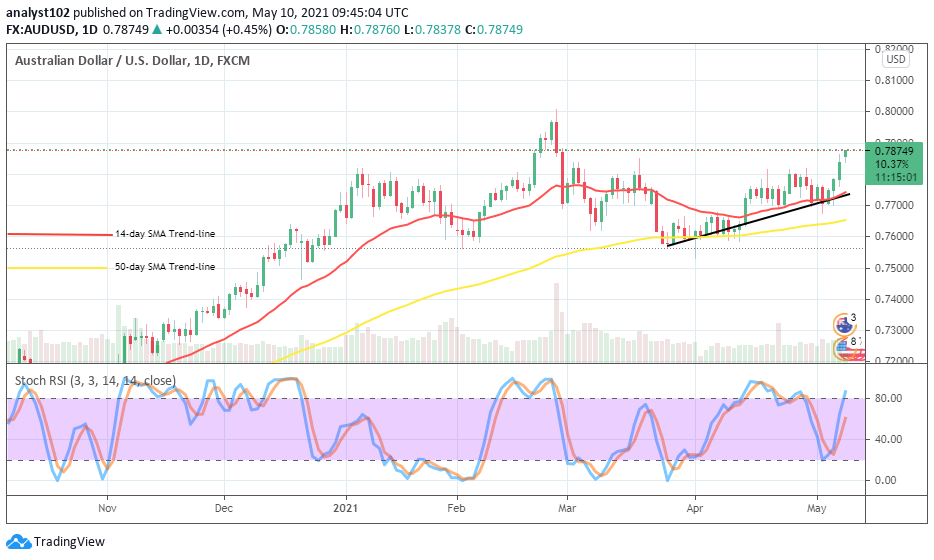
The AUD/USD daily chart reveals that the base coin has pushed further against the market worth of USD. On May 7, a bullish candlestick emerged breaking through resistance at 0.7800 to set the base valued coin on a pathway to another higher trading area. The bullish trend-line drew across space between the SMAs. The 14-day SMA trend-line is above the 50-day SMA indicator. The Stochastic Oscillators have crossed northwardly from a low range of 20 or thereabout to suggest an ongoing buying pressure in the fiat currency pair. Will the AUD/USD trade put more uptrend forces?
From every angle of most trading indicators, the AUD/USD market now appears to push more to the north in the close session. Buyers would need to add more pressure on the swing high currently achieved in the market. The better technical ideal trading support for the present price upswing is located at the level of 0.7800.
On the contrary to upsides, a price rejection at 0.7800 resistance point will most likely bring about a resumption of uptrend correction. In the meantime, if that assumed market sentiment eventually plays out, the pair may get dropped for a retest of a lower value around the support of 0.7700 in the long run.
In summary, the AUD/USD has seemingly garnered the required momentum to spring northbound more in the long run a bit over the previous height value of 0.8000 in the near time. AUD/USD 4-hour Chart
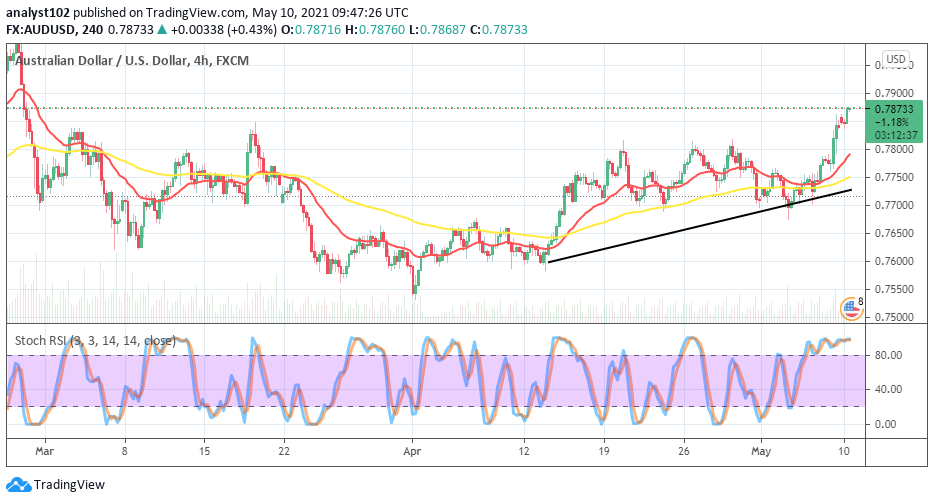
After a line of sideways price outlook that featured between April 15 and May 7 around the points of 0.7700 and 0.7800, The AUD/USD 4-hour trading chart now shows a northward breakout at the upper resistance trading zone to signify a definite change of market direction. The 14-day SMA trend-line has slightly bent towards the north over the 50-day SMA indicator to place a supportive point close below the 0.7800 level. As of writing, price trades around the value of 0.7875. The Stochastic Oscillators are in the overbought region moving in a consolidation manner to denote an existence of buying pressure dominating the currency pair market. That said, price is expected to reach a high of 0.8000 in the next session.
Note: Forexschoolonline.com is not a financial advisor. Do your research before investing your funds in any financial asset or presented product or event. We are not responsible for your investing results.
Learn to Trade Forex Online
AUD/USD Market Breaks Past the Resistance of 0.7800 to Trade at a Higher Point
Footer

ForexSchoolOnline.com helps individual traders learn how to trade the Forex market
WARNING: The content on this site should not be considered investment advice and we are not authorised to provide investment advice. Nothing on this website is an endorsement or recommendation of a particular trading strategy or investment decision. The information on this website is general in nature so you must consider the information in light of your objectives, financial situation and needs.
Investing is speculative. When investing your capital is at risk. This site is not intended for use in jurisdictions in which the trading or investments described are prohibited and should only be used by such persons and in such ways as are legally permitted. Your investment may not qualify for investor protection in your country or state of residence, so please conduct your own due diligence or obtain advice where necessary. This website is free for you to use but we may receive a commission from the companies we feature on this site.
We Introduce people to the world of currency trading. and provide educational content to help them learn how to become profitable traders. we're also a community of traders that support each other on our daily trading journey
Forexschoolonline.com is not a financial advisor. Do your research before investing your funds in any financial asset or presented product or event. We are not responsible for your investing results.

Leave a Reply