AUD/USD Price Prediction – July 24
The AUD/USD market operation averages a 0.7000 resistance line. The few hours have recorded that the price has been trading between 0.6977 and 0.6893 value lines at a minute negative percentage rate of 0.40.
AUD/USD Market
Key Levels:
Resistance levels: 0.7000, 0.7100, 0.7200
Support levels: 0.6800, 0.6700, 0.6600
AUD/USD – Daily Chart
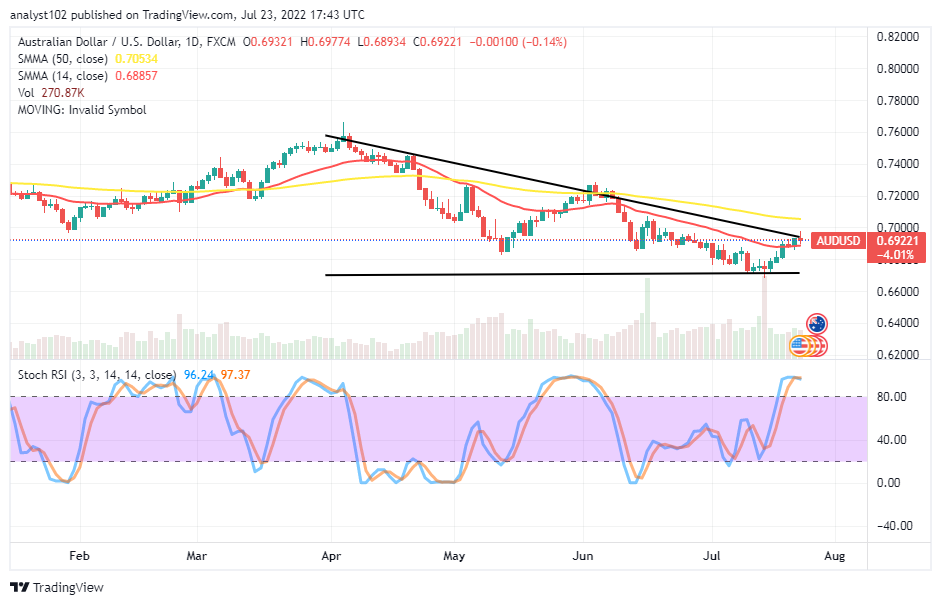
The AUD/USD daily chart showcases the currency pair market averages 0.7000 resistance level near below the trend line of the bigger SMA. The 14-day SMA indicator is underneath the trend line of the 50-day SMA indicator. The Stochastic Oscillators are in the overbought region with the lines closed within. The bearish trend line drew southward over the smaller SMA to touch a resistance point closely over the smaller SMA. A bearish candlestick is in the making to signify price may resume a downward-trending motion soon. Will the AUD/USD market bulls lose momentum around the 0.7000 resistance?
Going by the reading of some indicators, the AUD/USD market operations may resume a downward-trending motion soon as the currency pair market averages a 0.7000 resistance level. As it is, it would be technically ideal for the long-position takers to suspend the execution of new buying orders at the current trading capacity for a while.
On the downside of the technical analysis, the AUD/USD market short-position takers may wait until a bearish candlestick emanates below the 0.7053 resistance before considering launching selling orders afterward. However, a sustainable downward push against the trend line of the 14-day SMA may be a reliable signal to the downside resumption.
The analytics, at a glance, and the general overview verdict on the AUD/USD market suggest selling force will prevail in this currency pair operation soon. AUD/USD 4-hour Chart
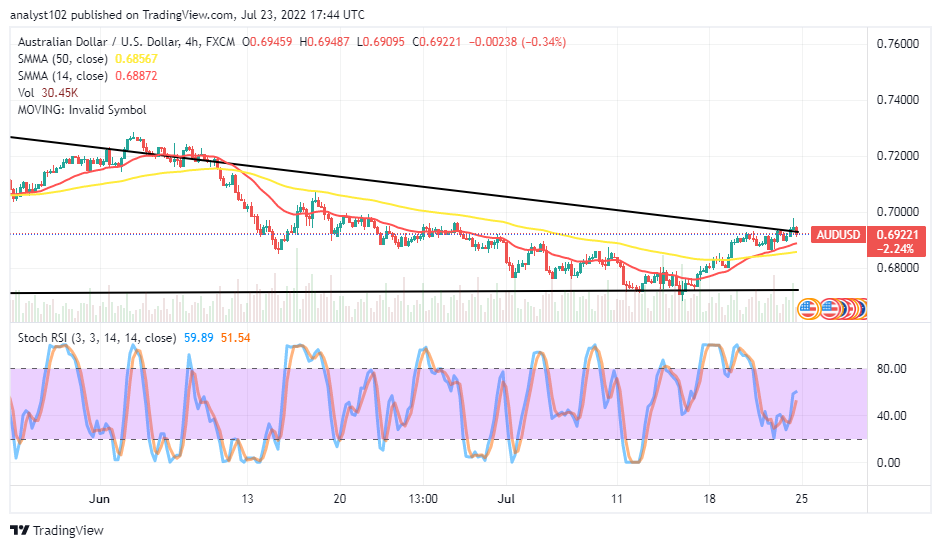
The AUD/USD medium-term chart showcases the currency pair market averages at the 0.7000 resistance level. The 14-day SMA indicator has intercepted the 50-day indicator. The bearish trend line drew southward to markdown an area of higher-trading resistance above the SMAs. The Stochastic Oscillators have crossed northbound from within the ranges of 20 and 40. And they have briefly positioned over the higher range point.
Note:Forexschoolonline.com is not a financial advisor. Do your research before investing your funds in any financial asset or presented product or event. We are not responsible for your investing results.
Learn to Trade Forex Online
AUD/USD Market Averages 0.7000 Resistance
Footer

ForexSchoolOnline.com helps individual traders learn how to trade the Forex market
WARNING: The content on this site should not be considered investment advice and we are not authorised to provide investment advice. Nothing on this website is an endorsement or recommendation of a particular trading strategy or investment decision. The information on this website is general in nature so you must consider the information in light of your objectives, financial situation and needs.
Investing is speculative. When investing your capital is at risk. This site is not intended for use in jurisdictions in which the trading or investments described are prohibited and should only be used by such persons and in such ways as are legally permitted. Your investment may not qualify for investor protection in your country or state of residence, so please conduct your own due diligence or obtain advice where necessary. This website is free for you to use but we may receive a commission from the companies we feature on this site.
We Introduce people to the world of currency trading. and provide educational content to help them learn how to become profitable traders. we're also a community of traders that support each other on our daily trading journey
Forexschoolonline.com is not a financial advisor. Do your research before investing your funds in any financial asset or presented product or event. We are not responsible for your investing results.

Leave a Reply