AUD/USD Price Prediction – July 10
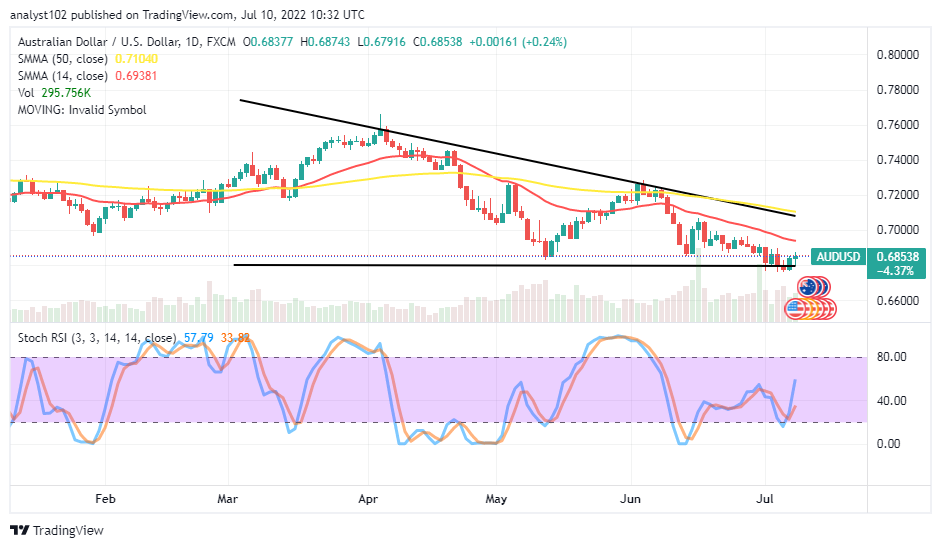
It has been that the AUD/USD market attempts to swing northward from a support line of around 0.6800. Price has featured between the high and low of 0.6874 and 0.6791 at a minute percentage rate of 0.24 positive.
AUD/USD Market
Key Levels:
Resistance levels: 0.6900, 0.7000, 0.7100
Support levels: 0.6800, 0.6700, 0.6600
AUD/USD – Daily Chart
The AUD/USD daily chart showcases the currency pair price attempts to swing northward from the 0.6800 support level. The horizontal line is drawn at the support point to mark it down for any critical reversion that can occur at no time. The 14-day SMA indicator is underneath the 50-day SMA indicator. The Stochastic Oscillators have crossed northbound from the range of 20, briefly reaching past the range of 40 to signify that a buying force is in dominance. Will the AUD/USD market sustain its northward swings above 0.6800?
The trading indicators are the AUD/USD market will sustain its northward swings above the 0.6800 support level in the subsequent operations. With the emergence of a bullish candlestick briefly bottoming below the 0.6800 support level, long-position takers may have to take to build up along the following price actions to the upside.
On the downside of the technical analysis, the AUD/USD trade bears may have to be on the lookout for any possible rejection of price reaction around the 0.6938 resistance level as indicated by the 14-day SMA before considering a selling order at a close-range line. The higher resistance range value is at 0.7104.
The analytics, at a glance, now appears that bulls have found a baseline around the 0.6800 support level that will allow buy orders already taken around it to run higher into profits. AUD/USD 4-hour Chart
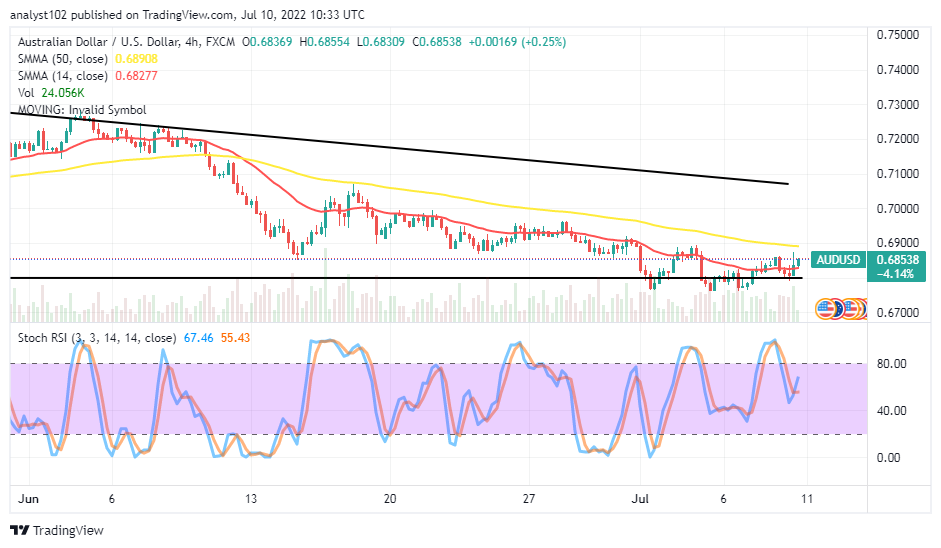
The AUD/USD medium-term chart reveals the currency pair market makes attempts to swing northward. The 14-day SMA indicator is underneath the 50-day SMA indicator. The horizontal line drew around 0.6800, closely below the SMAs. The Stochastic Oscillators have crossed northbound from a range of 55. The situation seems set for a round of buying cycle provided the value line mentioned doesn’t breach southward past in the near time.
Note:Forexschoolonline.com is not a financial advisor. Do your research before investing your funds in any financial asset or presented product or event. We are not responsible for your investing results.
Learn to Trade Forex Online
AUD/USD Market Attempts to Swing Northward
Footer

ForexSchoolOnline.com helps individual traders learn how to trade the Forex market
WARNING: The content on this site should not be considered investment advice and we are not authorised to provide investment advice. Nothing on this website is an endorsement or recommendation of a particular trading strategy or investment decision. The information on this website is general in nature so you must consider the information in light of your objectives, financial situation and needs.
Investing is speculative. When investing your capital is at risk. This site is not intended for use in jurisdictions in which the trading or investments described are prohibited and should only be used by such persons and in such ways as are legally permitted. Your investment may not qualify for investor protection in your country or state of residence, so please conduct your own due diligence or obtain advice where necessary. This website is free for you to use but we may receive a commission from the companies we feature on this site.
We Introduce people to the world of currency trading. and provide educational content to help them learn how to become profitable traders. we're also a community of traders that support each other on our daily trading journey
Forexschoolonline.com is not a financial advisor. Do your research before investing your funds in any financial asset or presented product or event. We are not responsible for your investing results.

Leave a Reply