AUD/USD Price Prediction – January 31
Currently, the AUD/USD market activity springs at 0.7000 after a long line of downing in its valuation. The currency pair price now trades between the value lines of 0.7057 and 0.6987, maintaining a minute percentage of 0.85.
AUD/USD Market
Key Levels:
Resistance levels: 0.7100, 0.7200, 0.7300
Support levels: 0.7000, 0.6900, 0.6800
AUD/USD – Daily Chart
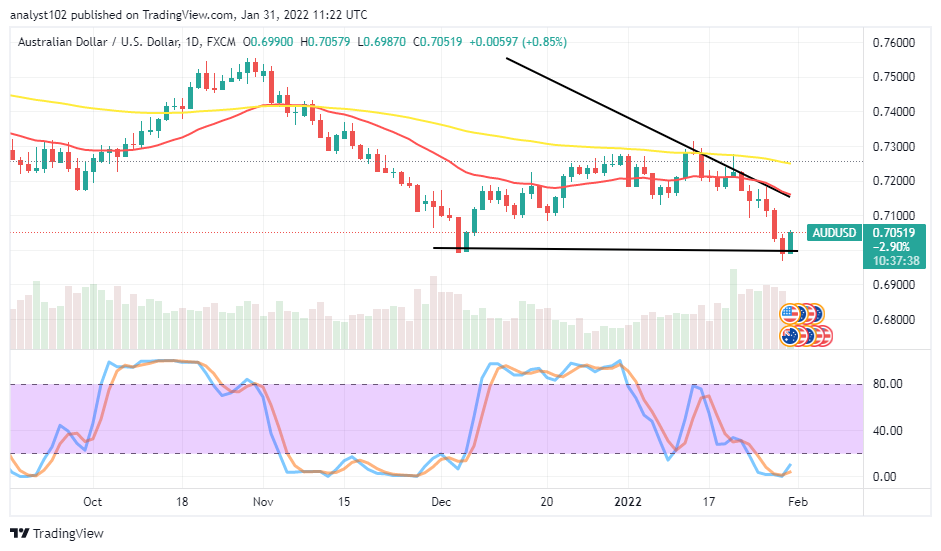
The AUD/USD daily chart shows the currency pair market activity springs up around 0.7000. The 14-day SMA indicator is underneath the 50-day SMA indicator. The baseline drawn at the value line showcases the critical support that price failed to breach further to the downside. The Stochastic Oscillators are in the oversold region. And they have conjoined their lines, crossing northbound within it to indicate that price is currently experiencing an upward force.  Will the AUD/USD price lose momentum as the market activity springs at the 0.7000 level?
The AUD/USD price is expected not to lose momentum in the near time as the market activity springs at the 0.7000 level. With the length of the current bullish candlestick in the making, stemming from the value line, subsequent trading sessions may potentially gain more positions to the upside. Long-position traders have to be wary of their stances as there may be a sudden reversal around the point mentioned earlier in no time.
On the downside of the technical analysis, the AUD/USD market short-position traders may have to suspend taking a re-launch of their stances in the market for a while. Price currently appears, embarking on a rebounding moving outlook, signaling the need to cease further selling orders for some time.
In summary, the AUD/USD market operation has seemingly embarked upon a rebounding moving force, signaling the possibility of achieving more ups than downs in the subsequent trading sessions. AUD/USD 4-hour Chart
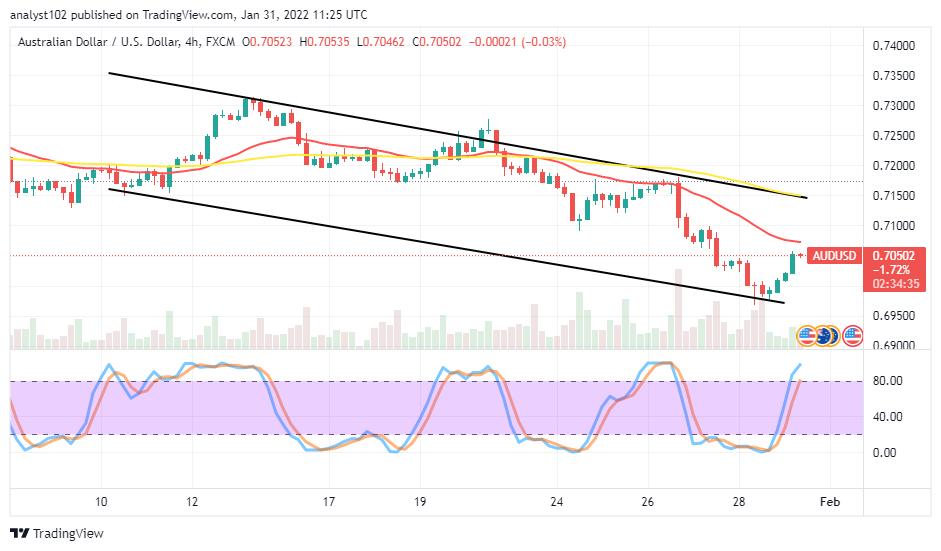
The GBP/USD 4-hour chart reveals the currency pair market activity springs from a lower spot around 0.7000. The The50-day SMA indicator is above the 14-day SMA indicator. The bearish channel trend lines southward to indicate that a downward force is still in the card. The Stochastic Oscillators have slightly moved into the overbought region, seemingly attempting to close their line a bit over the range of 80. If a bullish candlestick eventually emerges against the trend line of the 14-day SMA, the resistance level at 0.7100 will be traded past northwardly in the following sessions. A sudden fearful rejection around the trading indicator may lead to letting the market go back depressing to its previous lower trading zones.
Note:Forexschoolonline.com is not a financial advisor. Do your research before investing your funds in any financial asset or presented product or event. We are not responsible for your investing results.


Leave a Reply