AUD/USD Prediction – April 26
The AUD/USD market worth has been on a slow and steady increase since the emergence of the April 14 spike.
AUD/USD Market
Key Levels:
Resistance levels: 0.7900, 0.8000, 0.8100
Support levels: 0.7600, 0.7500, 0.7400
AUD/USD – Daily Chart
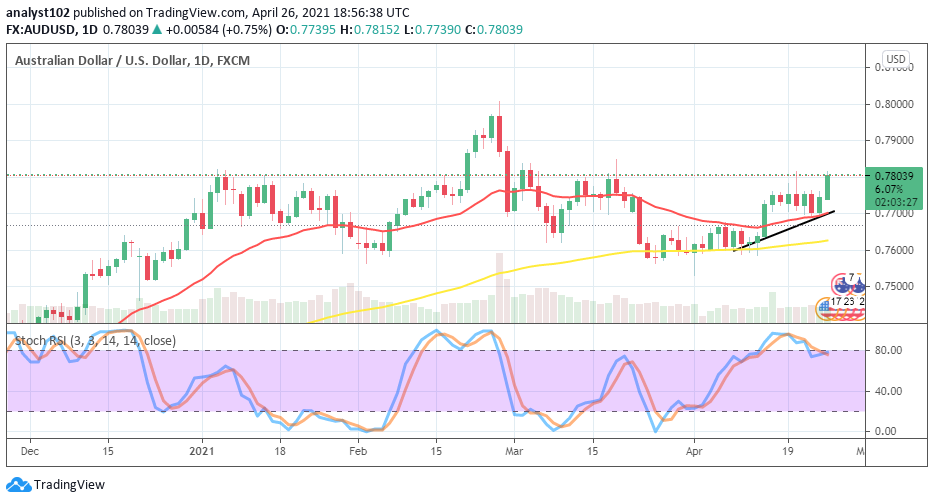
The formation of variant trading candlesticks in the AUD/USD market has been featuring to favor the up[side operations on a less-active move. As a result of that order, the currency pair had to experience a small line of higher lows which have led to a bullish candlestick in the making currently. The 14-day SMA trend-line is over the 50-day SMA indicator. The Stochastic Oscillators are into the overbought region moving in a consolidation manner to showcase the extent to which bulls are pushing in the market. Will the AUD/USD market keeps longing for a long time?
There are indications that the AUD/USD bulls will still push furthermore for long positioning of orders in the next sessions in this market. As of writing, the price has been on a high pressure moving intensifying efforts to trade past the point of 0.7800 as of writing. A successful breakthrough of that line will most likely set the currency pair’s value on to achieving another higher point around the immediate resistance level of 0.7900 in a near time
On the contrary, as regards taking a look at the probable downside of this market, bears will have to be on the lookout for a rejection of price at a high zone coupled with an emergence of a bearish candlestick to take its full formation before a decent entry can be ensured for sell order. And, that assumption may come to play after a few days more sessions.
Summarily, there may still be some more pushes to the north in the next sessions. But, the uptrend may be exhausted after achieving a peak level to give way for a sell entry after a while. AUD/USD 4-hour Chart
The AUD/USD medium-term chart depicts that the market bullish run is on the verge of being exhausted below the level of 0.78500. All the candlesticks that have formed are in serial order to the north, The formation takes a kind of straight-line trend on the buy signal side of the 14-day SMA trend-line which is situated over the 50-day SMA indicator. The Stochastic Oscillators are in the overbought region with conjoined hairs. That signifies the possibility of getting to see an indecision trading situation of this market in the near time.
Note: Forexschoolonline.com is not a financial advisor. Do your research before investing your funds in any financial asset or presented product or event. We are not responsible for your investing results.
Learn to Trade Forex Online
AUD/USD Makes a Notable Pull-Up After Featuring a Line of Higher Lows
Footer

ForexSchoolOnline.com helps individual traders learn how to trade the Forex market
WARNING: The content on this site should not be considered investment advice and we are not authorised to provide investment advice. Nothing on this website is an endorsement or recommendation of a particular trading strategy or investment decision. The information on this website is general in nature so you must consider the information in light of your objectives, financial situation and needs.
Investing is speculative. When investing your capital is at risk. This site is not intended for use in jurisdictions in which the trading or investments described are prohibited and should only be used by such persons and in such ways as are legally permitted. Your investment may not qualify for investor protection in your country or state of residence, so please conduct your own due diligence or obtain advice where necessary. This website is free for you to use but we may receive a commission from the companies we feature on this site.
We Introduce people to the world of currency trading. and provide educational content to help them learn how to become profitable traders. we're also a community of traders that support each other on our daily trading journey
Forexschoolonline.com is not a financial advisor. Do your research before investing your funds in any financial asset or presented product or event. We are not responsible for your investing results.

Leave a Reply