AUD/USD Prediction – July 12
The currency trading position of AUD/USD features a position around the level of 0.7500. Notably, the Australian Dollar has slightly pulled up against the valuation of the US Dollar to trade around 0.7489 at a rate
AUD/USD Market
Key Levels:
Resistance levels: 0.7600, 0.7700, 0.7800
Support levels: 0.7400, 0.7300, 0.7200
AUD/USD – Daily Chart
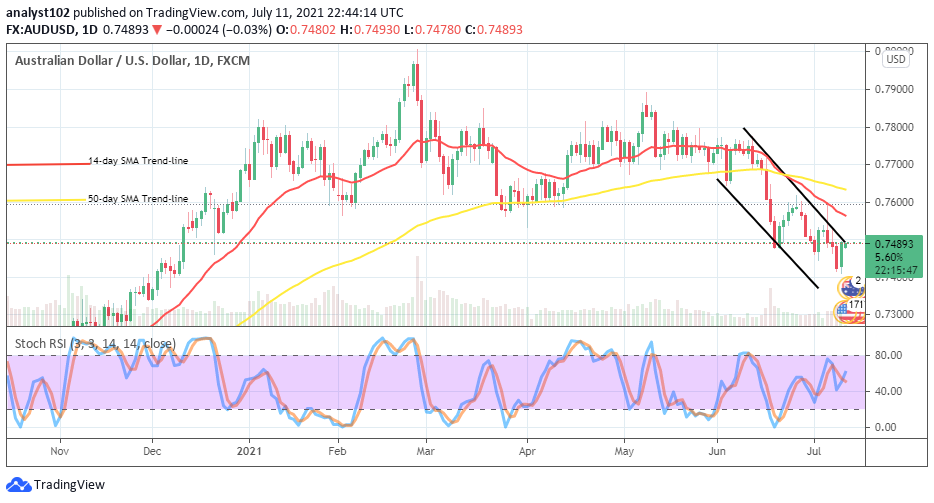
The AUD/USD daily chart now exhibits that the currency pair’s valuation features position around the level of 0.7500. The bearish channels are also kept intact by the market. The SMAs are above the current trading point as the 50-day SMA indicator is above the 14-day SMA trend-line. The Stochastic Oscillators are in between the ranges of 80 and 40, pointing toward the northbound. That indicates that a force to the upside is gradually emanating to probably signal a pause in the getting smooth downward ride of the currency pair trade for a while.
Will the AUD/USD push out of the bearish channels soon as it features position around 0.7500?
The AUD/USD market operation features position around the level of 0.7500, probably in the wake to locate resistance later on between around the points of 0.7600 and the value earlier mentioned to allow the bearish trend to continue. Going by that assumption, bulls are therefore needed to exercise some degrees of patience while launching positions.
The market levels between 0.7500 and 0.7600 are the major trading areas where the AUD/USD market bears expected to go for a re-launch of their positions as far as this current bearish movement is concerned. A sudden breakout for a hold above the bigger value earlier stated may cause a panic trading situation against the present downward trend of the currency pair.
Summarily, the currency pair seemingly, heading up for a resistance trading zone probably, around the levels of 0.7500 and 0.7600 to allow bears to retake their positions in the market. Meanwhile, a push for a hold above the higher value mentioned may probably pose a change against the present bearish trend.
AUD/USD 4-hour Chart
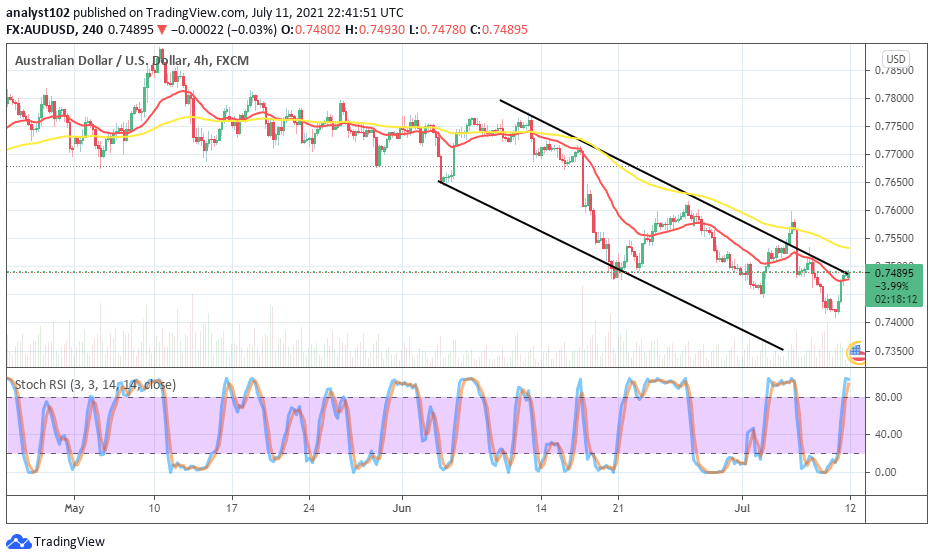
The AUD/USD medium-term chart displays that the currency pair features position at an overbought trading level as suggested by the Stochastic Oscillators. Like wisely, the 50-day SMA indicator is over the 14-day SMA trend-line, as they both point toward the south direction. Equally, the bearish channels are still relevant in the determination of the market’s next direction. Being as it is, it is highly expected of bears to push back price downward in no time as there has been a sign that the lines of Stochastic Oscillators will soon cross, most probably to the south.
Note: Forexschoolonline.com is not a financial advisor. Do your research before investing your funds in any financial asset or presented product or event. We are not responsible for your investing results.


Leave a Reply