AUD/USD Price Prediction – October 24
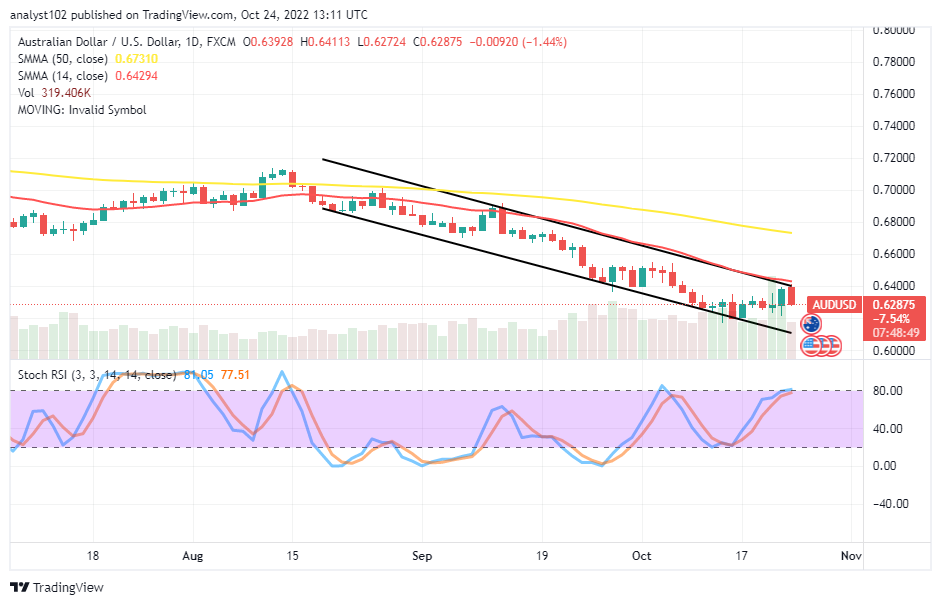
There has been a notable reclaiming-energy effort put in by the AUD/USD traders as the exchange rate decreases again at the ).6400 resistance after hitting a hard point. ).6411 and 0.6272 trading zones have been the high and the low-value lines within which the price has been trading over the last hours into today’s sessions.
AUD/USD Market
Key Levels:
Resistance levels: 0.6400, 0.6500, 0.6600
Support levels: 0.6100, 0.6000, 0.5900
AUD/USD – Daily Chart
The daily chart showcases that the AUD/USD trade exchange rate decreases to 0.6400. That resistance value point has been confirmed by the 14-day SMA indicator at 0.64294, underneath the 0.67310 value line of the 50-day SMA indicator. The Stochastic Oscillators are at 77.51 and 81.05 range values, seemingly attempting close their lines around those spots. A bearish candlestick is the making to signify the real price direction. What circumstance could indicate the end of the current bearish trading cycle for the AUD/USD?
The SMA trend lines and the Stochastic Oscillators needed to complement each order at lower trading zones such that crosses occur to the upside in the AUD/USD market as the price exchange rate decreases at the 0.6400 resistance level. It is that the bears have taken over the buying operations.
On the technical downside, long-position placers find breaching the 0.6400 resistance level un-easy. The AUD/USD market sellers need to capitalize on the present bearish-emerging candlestick to press the trend southward further to logical lower-trading around the resistances of either 0.6200 or 0.6100 at the minimum.
The technical analysis at a glance has it that the selling cycle yet prevails over the buying intent, while the market cannot surge past the 0.6400 resistance level. AUD/USD 4-hour Chart
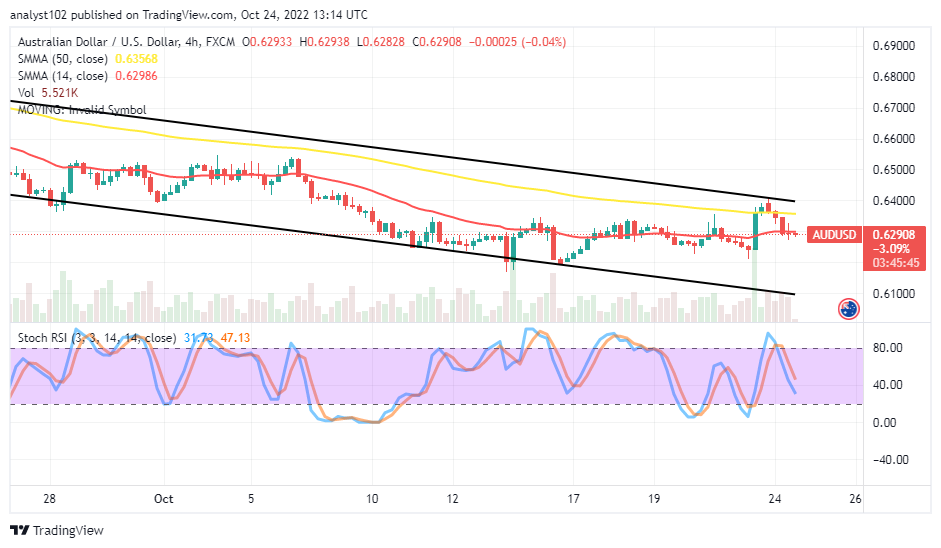
The medium-term AUD/USD chart portrays the currency exchange rate decreasing at the 0.6400 resistance level. The bearish channel trend lines drew to embody the SMA trend lines. The 14-day SMA indicator is at 0.62986, underneath the 0.63568 value point of the 50-day SMA indicator. The Stochastic Oscillators have crossed southbound from the overbought region to 47.13 and 31.73 range values. Although the gravity of the downward forces is getting less at the moment, a bullish candlestick needed to form at a point to stop seeing a continual dropping process of the current bearish trend afterward.
Note: Forexschoolonline.com is not a financial advisor. Do your research before investing your funds in any financial asset or presented product or event. We are not responsible for your investing results.
Learn to Trade Forex Online
AUD/USD Exchange Rate Decreases at 0.6400
Footer

ForexSchoolOnline.com helps individual traders learn how to trade the Forex market
WARNING: The content on this site should not be considered investment advice and we are not authorised to provide investment advice. Nothing on this website is an endorsement or recommendation of a particular trading strategy or investment decision. The information on this website is general in nature so you must consider the information in light of your objectives, financial situation and needs.
Investing is speculative. When investing your capital is at risk. This site is not intended for use in jurisdictions in which the trading or investments described are prohibited and should only be used by such persons and in such ways as are legally permitted. Your investment may not qualify for investor protection in your country or state of residence, so please conduct your own due diligence or obtain advice where necessary. This website is free for you to use but we may receive a commission from the companies we feature on this site.
We Introduce people to the world of currency trading. and provide educational content to help them learn how to become profitable traders. we're also a community of traders that support each other on our daily trading journey
Forexschoolonline.com is not a financial advisor. Do your research before investing your funds in any financial asset or presented product or event. We are not responsible for your investing results.

Leave a Reply