AUD/USD Prediction – June 7
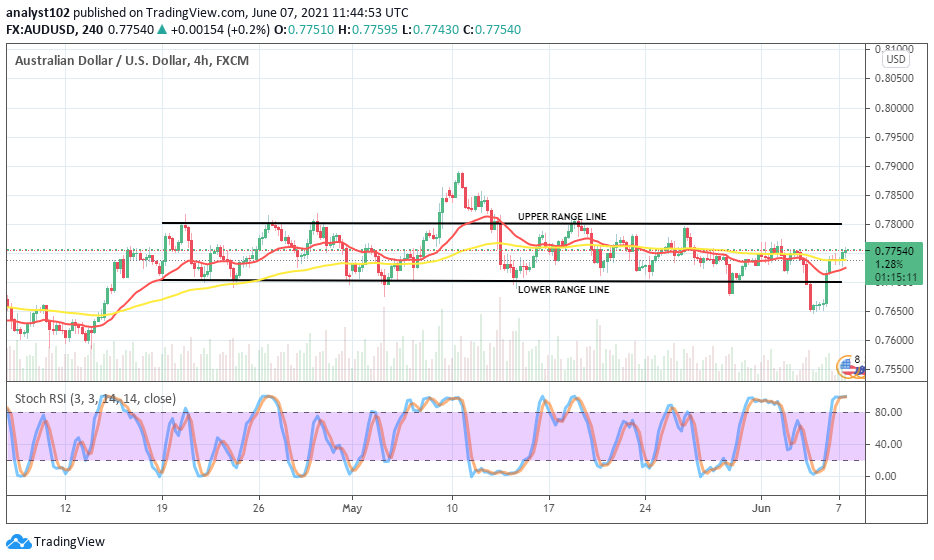
The long-kept of ranging levels of 0.7800 and 0.7700 are still relevant in describing the AUD/USD market’s trend. The currency pair’s value as of writing trades around 0.7759 at a percentage rate of 0.27.
AUD/USD Market
Key Levels:
Resistance levels: 0.7800, 0.7900, 0.8000
Support levels: 0.7700, 0.7600, 0.7500
AUD/USD – Daily Chart
The AUD/USD daily chart has it that the market worth of the currency pair is still very much held trading within range lines of 0.7800 and 0.7700 as all the SMAs are located around them as well. The 50-day SMA indicator is a bit underneath the lower range line as the 14-day SMA trend-line is located above them between the specified range-bound points. The upper range line drew to mark the current main resistance trading level of the market. The Stochastic Oscillators have moved up from the oversold region to point toward the northbound a bit past range 40. That signifies that an upswing is ongoing in the coin pairs trade.
Will the AUD/USD market stay more between the range lines?
It is most likely going to be that AUD/USD market will still be in range-bound trading zones furthermore. Most of the reliable buy entry points of the currency pair will be featuring from or around the lower range line. Therefore, traders going bullish needed to take note of that. Joining the move at the mid-way may not be good enough especially while price lacks an active notable move
The upper range-line, as it has been, will have to be an area of finding a sell order execution of the currency pair. A bearish candlestick is needed to form around the zone to be able to detect an appropriate time that that will potentially occur. In the meantime, the upper range-line value remains the best zone around traders considering going bearish needed to be on the lookout for before placing an entry.
The AUD/USD market technical analysis at a glance suggests that there are still more potential upsides than the downsides in the currency pair trading operations. 
AUD/USD 4-hour Chart
as regards the AUD/USD medium-term ranging price movements, three lines are majorly involved. But, our analysis will only focus on the mid-point that happens to be the level of 0.7750. On June 3, price drawdown below the lower range. But, shortly, the currency pair sprang upward back into the range-bound zones. Presently, the 50-day SMA indicator has been slightly traded past to the north as the 14-day SMA trend-line is closely located underneath it. The Stochastic Oscillators are with closed lines in the overbought region to signify a possibility of getting an end of further uprising in the market situation pairing the Australian Dollar with the United States Dollar.
Note: Forexschoolonline.com is not a financial advisor. Do your research before investing your funds in any financial asset or presented product or event. We are not responsible for your investing results.
Learn to Trade Forex Online
AUD/USD Currency-Pair Keeps Ranging Movements
Footer

ForexSchoolOnline.com helps individual traders learn how to trade the Forex market
WARNING: The content on this site should not be considered investment advice and we are not authorised to provide investment advice. Nothing on this website is an endorsement or recommendation of a particular trading strategy or investment decision. The information on this website is general in nature so you must consider the information in light of your objectives, financial situation and needs.
Investing is speculative. When investing your capital is at risk. This site is not intended for use in jurisdictions in which the trading or investments described are prohibited and should only be used by such persons and in such ways as are legally permitted. Your investment may not qualify for investor protection in your country or state of residence, so please conduct your own due diligence or obtain advice where necessary. This website is free for you to use but we may receive a commission from the companies we feature on this site.
We Introduce people to the world of currency trading. and provide educational content to help them learn how to become profitable traders. we're also a community of traders that support each other on our daily trading journey
Forexschoolonline.com is not a financial advisor. Do your research before investing your funds in any financial asset or presented product or event. We are not responsible for your investing results.

Leave a Reply