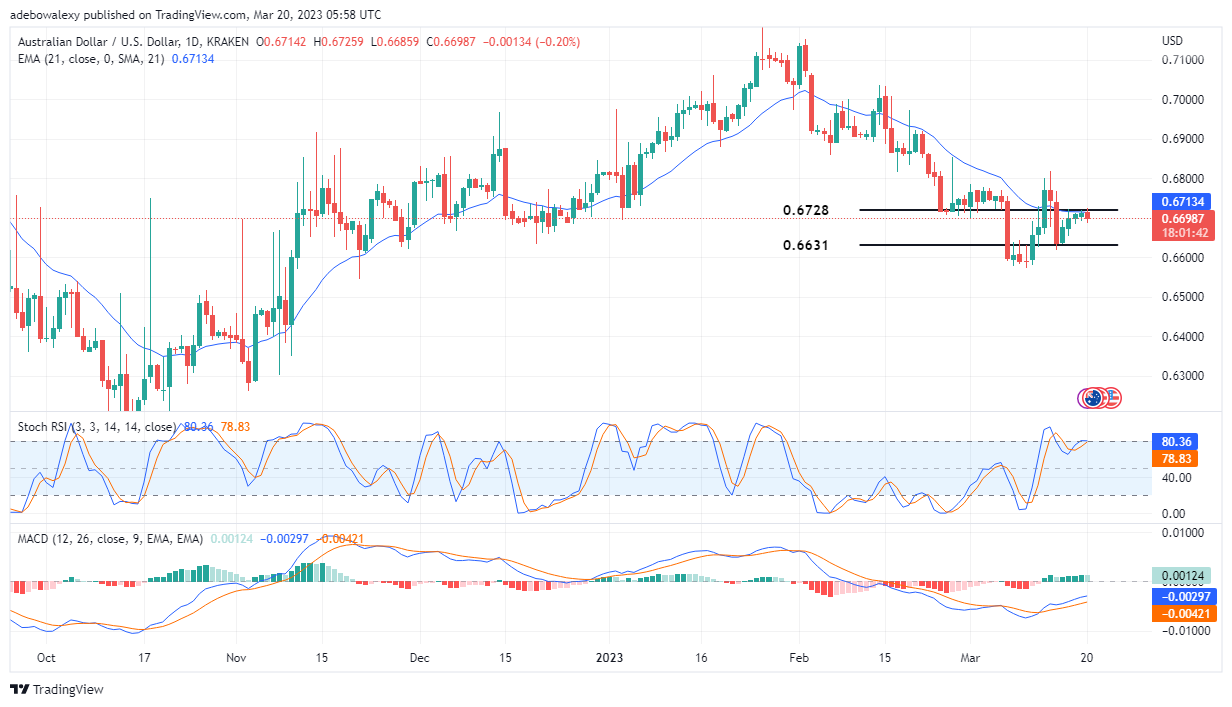
Buyers in the AUD/USD market have only recorded moderate profits in recent times. This started when price action tested the support level at 0.6631. At this point, price action in this market now appears as if it may reverse towards support after testing the resistance at 0.6728.
Major Price Levels:
Top Levels: 0.6698, 0.6750, and 0.6820
Floor Levels: 0.6650, 0.6610, and 0.6580

AUD/USD Faces Strong Resistance Below the 21-Day EMA Line
On the AUD/USD daily market, the price resistance level appears to be very strong. This can be observed in a red price candle that appeared on this chart right after price action tested the level. Also, this price reversal is happening below the 21-day daily EMA (Exponential Moving Average) line. The lines of the RSI are now approaching each other for a bearish reversal roughly at the 80 levels of the indicator. Although the MACD (Moving Average Convergence Divergence) indicator curve is still poised slightly upward, the bars of this indicator are already a pale green. Consequently, this shows that the upside momentum is weakening. All the indicator signs here are pointing out that upside momentum is growing weaker.

Buyers’ Attempt to Push the AUD/USD Price Up May Still Fail
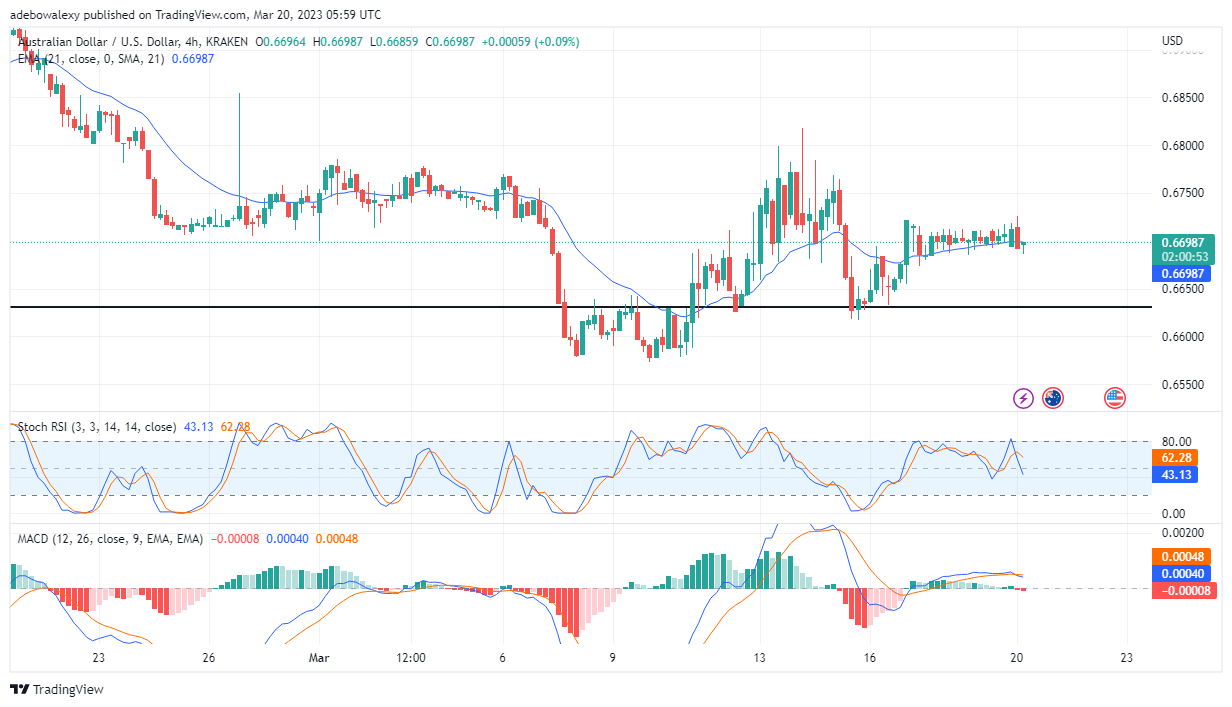
On the 4-hour market, the last price candle here is a green hammer price candle, which is just below the 21-day EMA line. Also, the RSI indicator continues to move toward the oversold zone of the indicator. Likewise, the MACD indicator lines have given a downward crossover above the equilibrium level, as red bars begin to form below the equilibrium point too. Going by market signs, it appears that the AUD/USD price may head toward the 0.6631 support in subsequent sessions.
Do you want to take your trading to the next level? Join the best platform for that here.


Leave a Reply